The Graph price prediction 2024-2030: Will GRT reach $10?

0
0

Key Takeaways:
- Our GRT predictions anticipate a high of $0.389 by the end of 2024.
- In 2025, it will range between $0.417 and $0.499, with an average price of $0.429.
- In 2030, it will range between $2.740 and $3.150, with an average price of $2.830
Due to its decentralized nature, The Graph offers access to competitive and cost-efficient datasets. The network boasts a 99.99% uptime and 24/7 availability. Central to The Graph’s operations are Subgraphs, APIs that organize and serve blockchain data to data consumers and developers.
Also Read: The Graph vs Alchemy: How Developers Define the Better Platform
The Graph has 100+ indexer nodes, 1.23 trillion served queries, and 70,000+ hosted projects. The GRT token acts as an incentive mechanism for The Graph network. It incentivizes network participants to provide data to end users and organize it effectively.
So, how high will GRT go? Is it a good investment? What will be its price in 2025? We explore these questions and more in the following sections.
Overview
| Cryptocurrency | The Graph |
| Ticker | GRT |
| Current Price | |
| Market Cap | |
| Trading Volume | |
| Circulating Supply | |
| All-time High | $0.3145 on Feb 12, 2021 |
| 24-hour High | |
| 24-hour Low |
The Graph price prediction: Technical analysis
| Metric | Value |
| Volatility (30-day Variation) | 13.69% |
| 50-day SMA | $0.2840 |
| 200-day SMA | 0.2526 |
| Sentiment | Bearish |
| Fear & Greed Index | 60 (Greed) |
| Green Days | 12/30 (40%) |
The Graph price analysis: GRT remains in consolidation
Key Takeaways
- GRT is in a gradual decline.
- The is a general indecision on market direction.
GRT/USD 1-day chart: GRT is range-bound
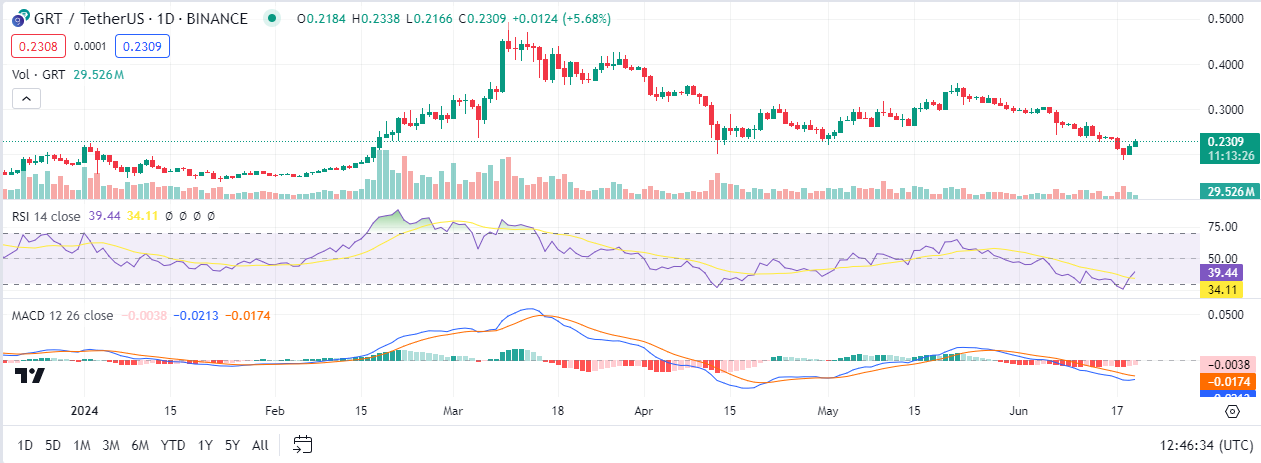
GRT/USD 1-day chart
GRT is trading within a range, but rather than move sideways, it is gradually rising. At current levels, it has lost over 50% from the year’s high. As shown by the MACD indicator, it registered negative momentum through June. The relative strength index line has broken above the signal line as it recovers.
GRT/USD 4-hour chart: GRT remains indecisive
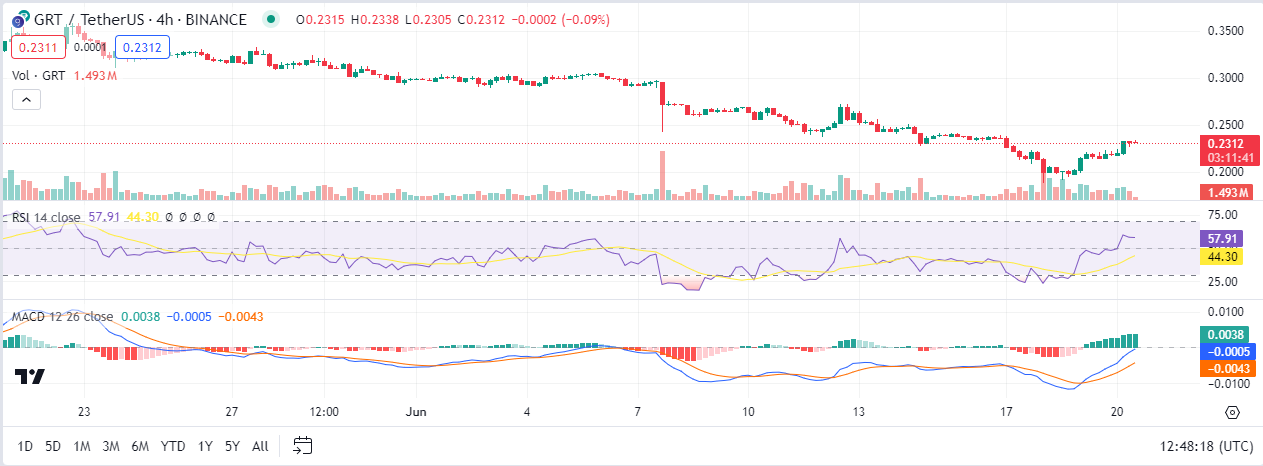
GRT/USD 4-hour chart
A characteristic of the 4-hour chart is the short candles, which can suggest indecision among traders about the market’s direction. The general trend, however, is bullish. Positive momentum has risen over the last fortyhours, and the RSI is in neutral territory.
The Graph technical indicators: Levels and action
Daily Simple Moving Average (SMA)
| Period | Value ($) | Action |
| SMA 3 | 0.2394 | SELL |
| SMA 5 | 0.2401 | SELL |
| SMA 10 | 0.2461 | SELL |
| SMA 21 | 0.2637 | SELL |
| SMA 50 | 0.2840 | SELL |
| SMA 100 | 0.3084 | SELL |
| SMA 200 | 0.2526 | SELL |
Daily exponential moving average (EMA)
| Period | Value ($) | Action |
| EMA 3 | 0.2654 | SELL |
| EMA 5 | 0.2786 | SELL |
| EMA 10 | 0.2953 | SELL |
| EMA 21 | 0.3000 | SELL |
| EMA 50 | 0.2998 | SELL |
| EMA 100 | 0.2896 | SELL |
| EMA 200 | 0.2539 | SELL |
What can we expect from GRT price analysis next?
Per our analysis, the current sentiment is bearish, while the Fear & Greed Index shows 60 (Greed). The Graph recorded 12/30 green days with 13.69% price volatility over the last 30 days. The charts indicate it will gradually rise over the short term.
Is GRT a good investment?
The Graph rivals many Web2 data oracles for its efficiency and low costs. GRT, its native token, however, remains a victim of general market dynamics and high volatility. The current sentiment is bearish, with predictions pointing to further price growth.
Recent news/ Updates
The Graph’s decentralized data is now available, increasing data autonomy and decentralization. Over 6,000 subgraphs, including AAVE, Balancer, Decentraland, Messari, and Quickswap, are available to query on The Graph network.
The Graph price prediction June 2024
GRT could break out higher from current levels. A break of resistance will result in a mini bull run, with the next target at $0.315. This month, it will average at $0.243 and drop to $0.204 at its lowest.
| Month | Potential Low ($) | Potential Average ($) | Potential High ($) |
| June | 0.204 | 0.243 | 0.315 |
The Graph price prediction 2024
As the second half of 2024 unfolds, GRT’s development track continues to provide more value to its users. The technical indicators are bullish on GRT and anticipate trading between $0.204 and $0.389.
| Year | Potential Low ($) | Potential Average ($) | Potential High ($) |
| 2024 | 0.204 | 0.341 | 0.389 |
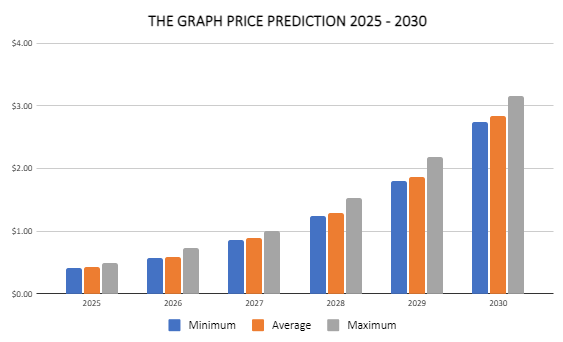
The Graph Price Predictions 2025 – 2030
| Year | Potential Low ($) | Potential Average ($) | Potential High ($) |
| 2025 | 0.417 | 0.429 | 0.499 |
| 2026 | 0.572 | 0.594 | 0.728 |
| 2027 | 0.864 | 0.888 | 1.010 |
| 2028 | 1.250 | 1.290 | 1.530 |
| 2029 | 1.800 | 1.860 | 2.180 |
| 2030 | 2.740 | 2.830 | 3.150 |
The Graph price prediction 2025
The Graph price forecast for 2025 sets the high at $0.4992. However, in the case of a market correction, the GRT price might rest at a minimum price of $0.4170, making an average of $0.4289.
The Graph price prediction 2026
The year 2026 will experience more bullish momentum. As per The Graph GRT price prediction, it will range between $0.5722 and $0.7278, with an average trading price of $0.5936.
The Graph GRT price prediction 2027
The Graph prediction climbs even higher into 2027. According to the prediction, it will range between $0.8642 and $1.01, with an average of $0.8879.
The Graph price prediction 2028
The analysis suggests a further acceleration in GRT’s growth by 2028. As per the GRT Price Prediction, the price of The Graph can reach between a minimum of $1.25 and a maximum of $1.53, an average of $1.29.
The Graph price prediction 2029
According to the GRT coin Price Prediction 2029, GRT’s price could reach a maximum and minimum of $2.18 and $1.18, respectively, with a year-round average of $1.86.
The Graph Foundation’s ongoing efforts to secure more global partnerships and achieve wider adoption of its token will play a pivotal role in this anticipated price rise.
The Graph price prediction 2030
The Graph forecast for 2030 suggests a price range of $2.74 and $3.15 and an average price of $2.83. This long-term optimistic view hinges on GRT’s increasing global recognition and adoption. The demand could surge as more users and systems incorporate the GRT token, increasing its value.
The Graph market price prediction: Analysts GRT price forecast
| Firm | 2024 | 2025 |
| Changelly | $0.84 | $0.51 |
| DigitalCoinPrice | $0.48 | $0.57 |
| CryptoPredictions | $0.23 | $0.24 |
Cryptopolitan’s GRT price predictions
Our predictions show that The Graph will achieve a high of $0.389 in the second half of 2024. In 2025, it will range between $0.417 and $0.499, with an average of $0.429. In 2030, it will range between $2.740 and $3.150, with an average of $2.830. Note the predictions are not investment advice. Seek independent consultation or do your own research.
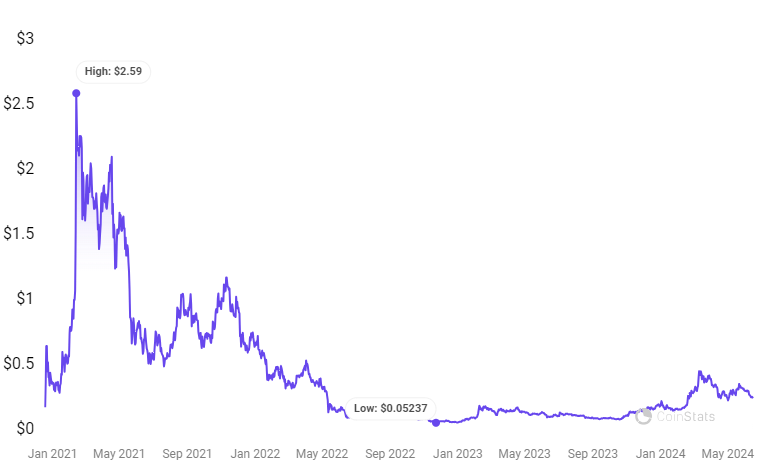
The Graph historic price sentiment
- Yaniv Tal, Brandon Ramirez, and Jennis Pohlman launched The Graph on the Ethereum blockchain in 2018.
- In June 2020, The Graph held a token sale that raised $5 million. Some participants included Multicoin Capital, Digital Currency Group (DCG), and DTC Capital.
- The Graph held its GRT public sale in October 2020 and raised $12 million. Each token sold at $0.03. Its mainnet launched in December 2020.
- In January 2021, another sale led by Tiger Global Management raised $50 million.
- Looking back, GRT had its best performance in 2021. The coin registered its all-time high at $2.88 on February 12, 2021.
- In February 2022, venture capital firms, including DCG, Multicoin Capital, NGC Ventures, Reciprocal Ventures, gumi Cryptos Capital, and HashKey, announced the launch of a $205 million ecosystem fund ‘The Graph’ protocol.
- In preceding years, GRT consistently traded below $0.7. In 2023, it fell below $0.2.
- It started recovering in 2024, breaking above $0.4 at its highest, reaching $0.45. It later corrected and traded at $0.24
0
0

 Manage all your crypto, NFT and DeFi from one place
Securely connect the portfolio you’re using to start.