
Hyperliquid Price Prediction: HYPE Eyes a Breakout Toward $77

0
0

Hyperliquid price prediction traders are watching a trendline that has been tested three times now, and something changed on that last attempt.
The first two retests broke down into fresh lower lows, but the third one told a different story: weak selling, no new low, and the price is still holding its ground above that zone.
Is this the setup where HYPE finally breaks free, or just another pause before the next leg down? This Hyperliquid price prediction maps out exactly what needs to happen next.
As with any breakout setup, there is real risk of a false move, a sudden reversal tied to broader Bitcoin sentiment, or a fast liquidity sweep against leveraged positions on either side.
Hyperliquid Price Right Now
Metric | Value |
Price | $58.999 (CoinGlass: $59.082, +3.57%) |
24h Futures Volume | $1.36B |
24h Spot Volume | $56.76M |
Market Cap | $14.87B |
Open Interest | $2.50B |
Circulating Supply | 252.56M |
Total Supply | 952.61M |
Max Supply | 952.61M |
Open interest measures the total value of $HYPE futures contracts still open in the market.
A reading of $2.50B against a $14.87B market cap shows a large share of activity is still coming from leveraged derivatives traders rather than spot buyers.
Data as of Aug 17, 2026, 12:13 IST (06:43 UTC).
Chart source: HYPE/TetherUS Perpetual, 4H timeframe, Binance via TradingView, captured Aug 17, 2026, 12:13 IST.
Methodology and data sources: Price and volume data from CoinGlass, liquidation figures from CoinGlass, and institutional flow context from Hyperliquid Daily on X.
Institutional Capital Is Showing Up in the HYPE Chart
A recent post from Hyperliquid Daily flagged that Multicoin Capital has invested more than $100 million into HYPE, with the fund's general partner Spencer Applebaum pointing to Hyperliquid's ability to generate real cash flow as the reasoning.
This kind of institutional allocation adds a fundamental layer to the current technical picture, and it lines up with the fading selling pressure seen on the third trendline retest.
Source: Hyperliquid Daily on X, posted 2 hours before this report, Aug 17, 2026.
HYPE Liquidation Data: Short Sellers Are Taking the Bigger Hit
The liquidation numbers point clearly in one direction over the past day.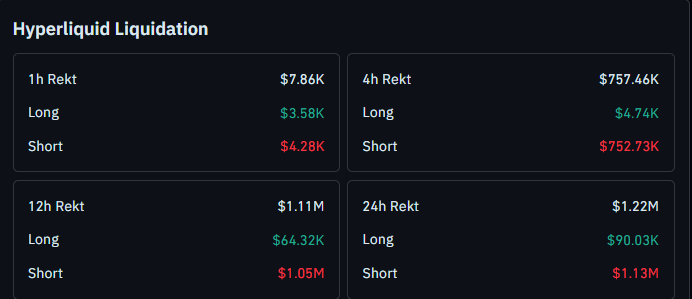
In the last hour, $7.86K was liquidated, with longs and shorts roughly split at $3.58K and $4.28K. But the picture changes fast over a longer window.
The 4-hour figure shows $752.73K in short liquidations against just $4.74K in longs, out of $757.46K total.
Zooming out to 24 hours, short liquidations reach $1.13M compared to $90.03K in longs, out of $1.22M rekt overall.
This lopsided pattern suggests traders positioned against HYPE have been forced out repeatedly as price held its ground near the trendline.
Source: CoinGlass liquidation data, Aug 17, 2026, 12:13 IST.
Hyperliquid Trend and Momentum: Key Takeaways
HYPE trades near $58.999, holding above a descending trendline after a third retest
The first two trendline retests produced fresh lower lows; the third did not, suggesting selling pressure is fading
A sustained hold above $57.989 keeps the current breakout attempt intact
Resistance levels sit at $63.450, $69.121, and a major level at $77.000
A close below $53.384 would shift the outlook bearish, opening the door to $51.135
Short liquidations dominate the past 24 hours by a wide margin, suggesting short sellers have been squeezed harder than buyers
Hyperliquid Price Prediction: What Does the 4-Hour Chart Show?
HYPE recently attempted a breakout above its descending trendline.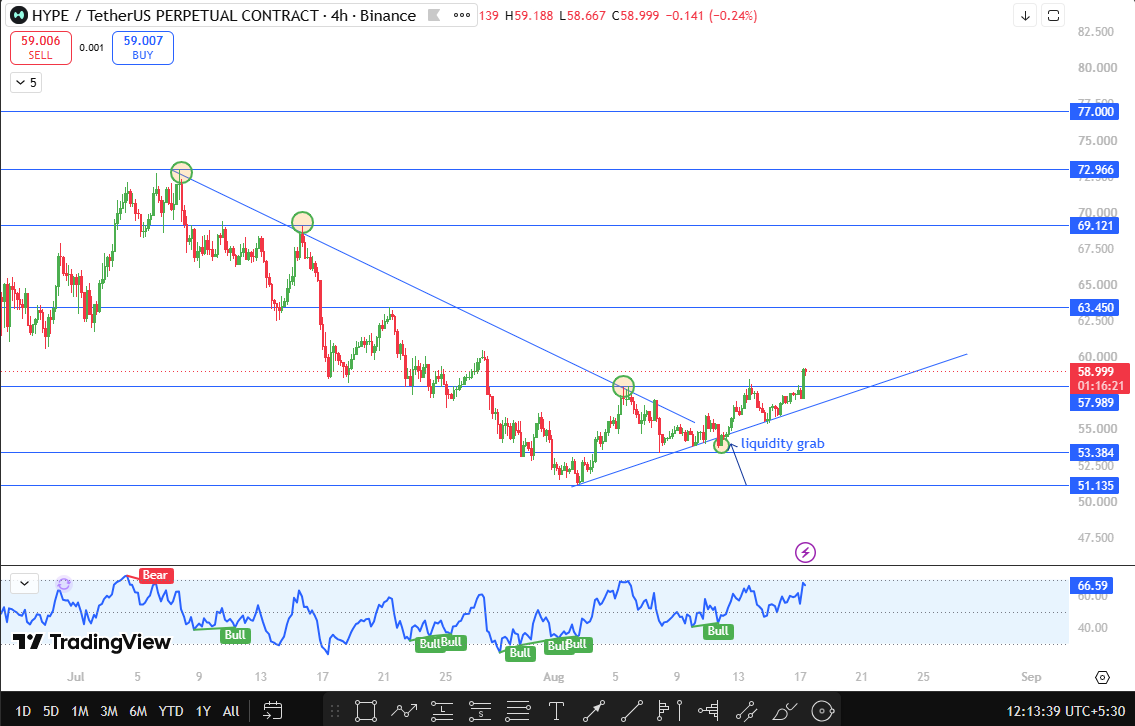
On the second retest of that same trendline, price printed a fresh lower low, extending the downtrend structure.
The third retest played out differently. Selling pressure was noticeably weaker, and price failed to make a new low this time.
HYPE is now trading above that third retest zone, which is the key detail shaping this setup.
The chart's built-in oscillator currently reads 66.59, tagged with a bullish marker, which lines up with the recent short-liquidation pressure and points to buyers holding some control in the near term.
Holding above $57.989 is the condition that keeps this breakout attempt valid. As long as that level holds, resistance sits first at $63.450.
A move through that opens room toward $69.121, with $77.000 marked as the major resistance above both of those levels.
A failure to hold $57.989 changes the picture. A break and close below $53.384 would signal the breakout attempt has failed, and the next support to watch would be $51.135.
Hyperliquid Technical Outlook Snapshot
Indicator | Signal |
Pattern | Third retest of descending trendline, no new lower low formed |
Built-in Oscillator | The bull tag is shown on recent candles, reading near 66.59 |
Immediate Bias | Constructive above $57.989, at risk below $53.384 |
HYPE Support and Resistance Levels to Watch
Type | Level | Note | % From CMP |
Resistance | $77.000 | Major resistance above the breakout structure | +30.5% |
Resistance | $69.121 | Secondary resistance target | +17.1% |
Resistance | $63.450 | First resistance if breakout holds | +7.5% |
Support/Trigger | $57.989 | Level needed to keep the breakout attempt valid | -1.7% |
Support | $53.384 | Breakdown triggers, invalidating the bullish case | -9.5% |
Support | $51.135 | Next support if $53.384 breaks | -13.3% |
Risk-Reward Table
Case | Trigger | Target |
Bullish | Holds above $57.989 | $63.450, then $69.121, then $77.000 |
Bearish | Close below $53.384 | $51.135 |
What Would Change This HYPE Price Prediction?
A 4-hour close below $57.989 would be an early warning sign, while a confirmed close below $53.384 would invalidate the bullish structure entirely.
On the upside, a decisive close above $63.450 would strengthen the case for a continued move toward $69.121 and $77.000.
A meaningful shift in the long-short liquidation balance, particularly if longs start absorbing more damage than shorts, would also be worth tracking against this setup.
How Bitcoin Sentiment Could Move HYPE
Hyperliquid remains sensitive to broader Bitcoin sentiment, as most altcoins are during periods of high leverage.
A risk-off shift in Bitcoin could pressure HYPE back toward the trendline and increase the odds of a breakdown through $53.384.
Continued strength in Bitcoin, paired with the institutional inflows already reported around HYPE, could support a faster move through the $63.450 and $69.121 resistance zones.
When This Hyperliquid Price Prediction Gets Revisited
This setup will be revisited if HYPE closes a 4-hour candle beyond either $57.989 on the downside or $63.450 on the upside, or if fresh institutional flow data changes the current picture.
Glossary
Descending Trendline: A line connecting a series of lower highs, often acting as resistance until price breaks through it
Open Interest: Total value of outstanding futures contracts not yet settled
Liquidation: Forced closure of a leveraged position once losses exceed the maintenance margin
Retest: When a price returns to a previously broken trendline or level to confirm it as new support or resistance
Bull, Base, and Bear Case
Bull Case: HYPE holds above $57.989 and clears $63.450, with institutional inflows adding support for a continued push toward $69.121 and eventually $77.000.
Base Case: HYPE consolidates between $53.384 and $63.450 as the market digests the third trendline retest without a clear directional confirmation yet.
Bear Case: HYPE fails to hold $57.989, breaks and closes below $53.384, and slides toward $51.135 as the breakout attempt fails.
Disclaimer
This article is for informational purposes only and does not constitute financial advice. Cryptocurrency markets are highly volatile, and prices can move sharply in either direction. Always do your own research and consult a licensed financial advisor before making investment decisions.
0
0

 Manage all your crypto, NFT and DeFi from one place
Securely connect the portfolio you’re using to start.

0
0

0
0

0
0

0
0