Shiba Inu (SHIB) Attracts More Long Trades, Faces Short-Term Decline Risks
29d ago•

bullish:
1
bearish:
0
Share

Shiba Inu’s (SHIB) futures traders have maintained a bullish outlook despite the meme coin’s price consolidation in the past month.
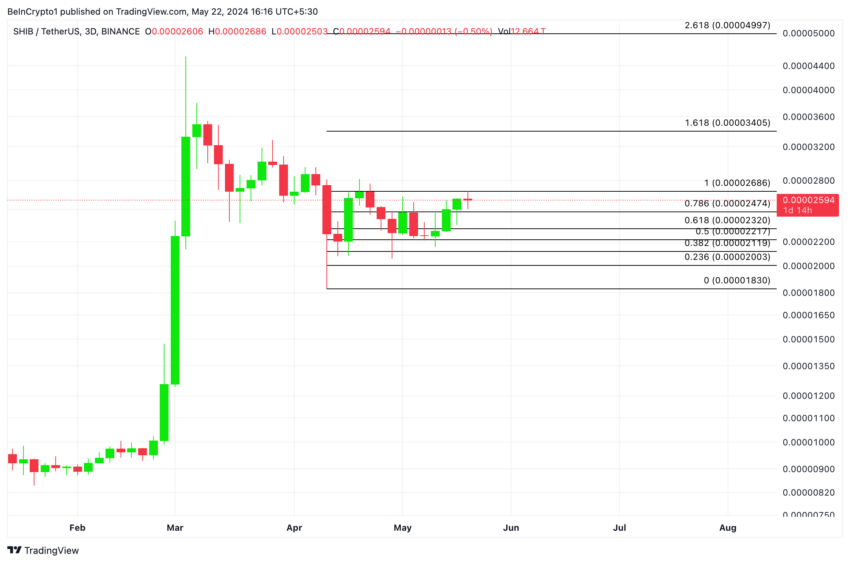
An assessment of the coin’s price movements on a 3-day chart revealed that it has trended within a parallel channel pattern since 12 April, witnessing resistance at $0.000027 and finding support at $0.00002.
Shiba Inu Long Traders Bet in the Coin’s Favor
SHIB’s futures open interest has trended upward since the beginning of the month. As of this writing, the meme coin’s futures open interest was $89 million, pegged at its highest since April 4.
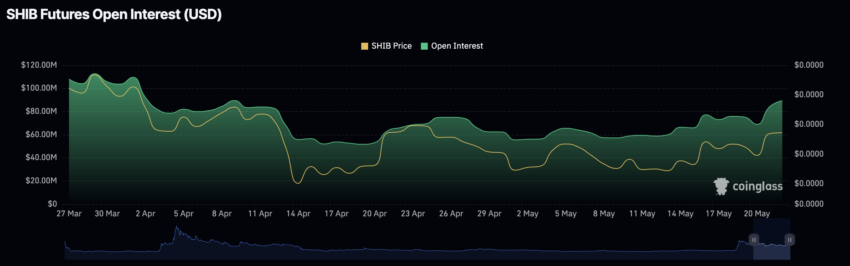 Shiba Inu Futures Open Interest. Source: Coinglass
An asset’s futures open interest refers to the total number of outstanding futures contracts that have not been closed or settled yet. When it surges, it suggests an uptick in the number of traders entering the futures market for that asset.
SHIB’s funding rate has maintained a positive value, confirming that the rise in its open interest is a bullish sign.
Read More: How To Buy Shiba Inu (SHIB) and Everything You Need To Know
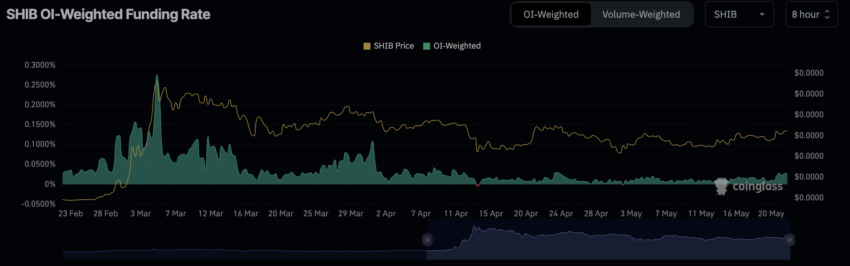 Shiba Inu Funding Rate. Source: Coinglass
Funding rates are used in perpetual futures contracts to ensure the contract price stays close to the spot price. When their value is positive, they suggest a strong demand for long positions.
The rise in an asset’s futures open interest, alongside a positive funding rate, signals an increased demand for long positions.
SHIB Price Prediction: Meme Coin’s Value May Fall If…
While SHIB’s futures traders are opening positions in favor of a rally, readings from its price charts hint at the possibility of a short-term decline.
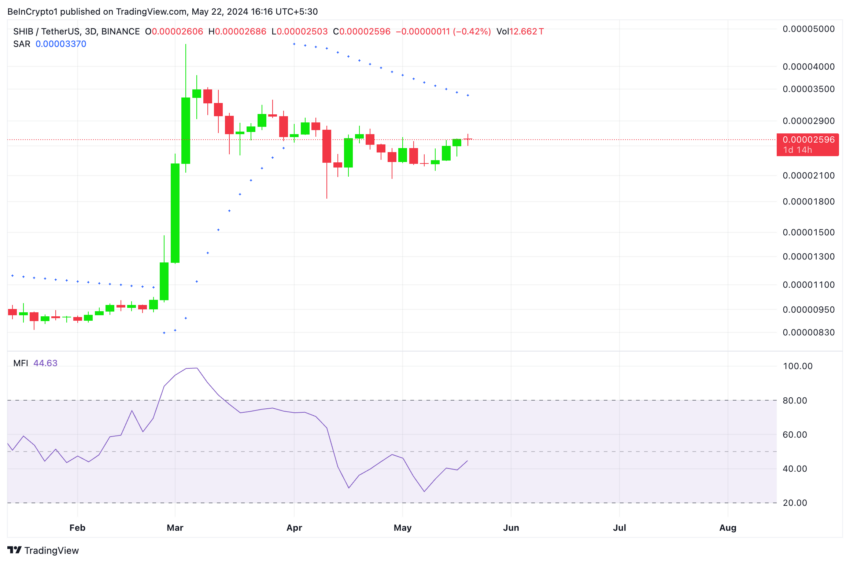
Firstly, the dots of its Parabolic SAR indicator were atop its price at price time. They have been positioned this way since April 3.
The indicator gauges an asset’s price direction and potential trend reversals. When its dots appear above the asset’s price, it signals that the current trend is downward and may continue if sentiment fails to improve.
Also, the coin’s Money Flow Index (MFI) rested below its 50 neutral zone at press time. 44.62 SHIB’s MFI showed that selling pressure exceeded accumulation amongst its traders.
 Shiba Inu Analysis. Source: TradingView
This indicator measures money flow into and out of an asset over a specific period. Its values range between 0 and 100. A reading below 50 suggests that, on average, there has been more downward price movement accompanied by higher trading volume than upward price movement.
If this trend continues, the coin’s price may fall from the $0.000026 region and settle at $0.000024.
 Shiba Inu Analysis. Source: TradingView
However, if this is invalidated, SHIB’s value is expected to rise to $0.00003.
29d ago•
bullish:
1
bearish:
0
Share


 Manage all your crypto, NFT and DeFi from one place
Securely connect the portfolio you’re using to start.

bullish:
0
bearish:
0


