
Chainlink Price Prediction August 2026: Is a Huge Rally Coming?

0
0

Chainlink has been showing signs of strength after breaking above a key resistance level that had limited its price for weeks.
At the same time, the network is seeing growing real-world adoption through new institutional-focused integrations, adding support to the bullish technical setup.
This combination of improving market structure and expanding utility has put LINK back on traders' radar.
In this Chainlink price prediction August 2026, we examine the key support and resistance levels, technical indicators, and fundamental developments that could shape LINK's next move.
Chainlink Price Today: Live Data and 24-Hour Change
LINK is trading near $8.362, down 1.03 percent over the past 24 hours. Futures volume sits at $260.28 million against spot volume of $47.16 million, with open interest at $415.40 million.
Market cap is $6.25 billion on a circulating supply of 748.09 million LINK against a total and max supply of 1 billion, meaning close to 75% of all LINK that will ever exist is already circulating.
Live futures and open interest figures can be tracked through live LINK data.
Chainlink News: Figure and HastraFi Bring Auto Loans to DeFi
Chainlink confirmed that Figure is bringing the 1.6 trillion dollar-plus U.S. auto loan market into DeFi, with the entire rail powered by Chainlink.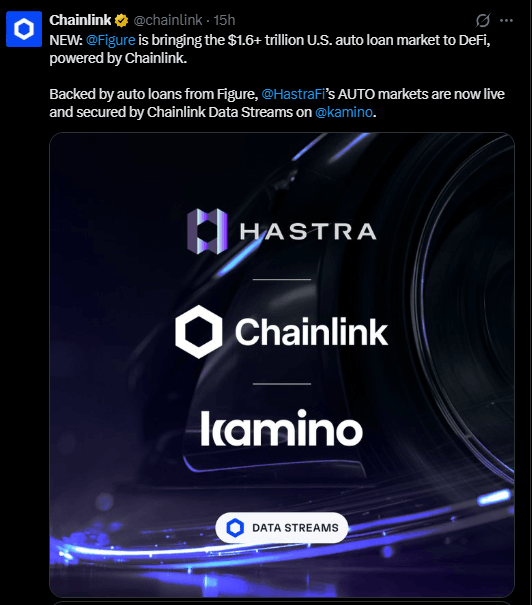
HastraFi's AUTO markets are now live on Kamino, backed by auto loans sourced from Figure and secured through Chainlink Data Streams, based on Chainlink's official update shared on X.
Quick Take
CMP: $8.362 (-1.03% on the day)
Daily trigger: close above $8.515, open $8.928-$9.312, then $10.052
Daily failure: below $8.006 keeps $7.789 and $7.524 as support
Weekly trigger: close above $8.928, open $10.868, then $14.395
Weekly failure: close below $8.164 exposes $7.789 and $6.991
Daily RSI: 52.01 | Weekly RSI: 42.58
Data as of July 30, 2026, IST
Chainlink Technical Forecast August 2026
On the daily chart, Chainlink broke out of a strong ascending trendline structure and then pushed on to break and close above a fresh higher high, a liquidity grab and reclaim pattern that shows buyers defending the move rather than letting it fade.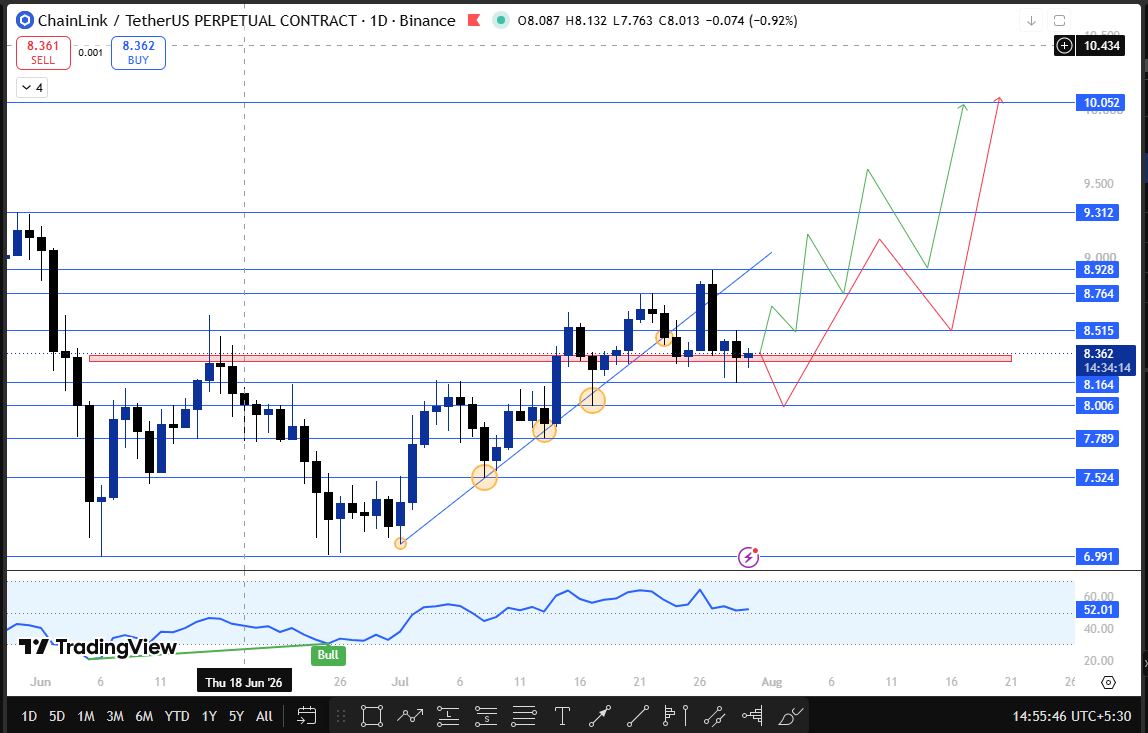
If the price closes above $8.515, the next resistance zone opens up at $8.928-$9.312, with $10.052 coming into view after that. A failure to close above $8.515 keeps the focus on $8.006, then $7.789 and $7.524, as the levels buyers need to defend near this critical retest zone.
The weekly chart tells a longer story.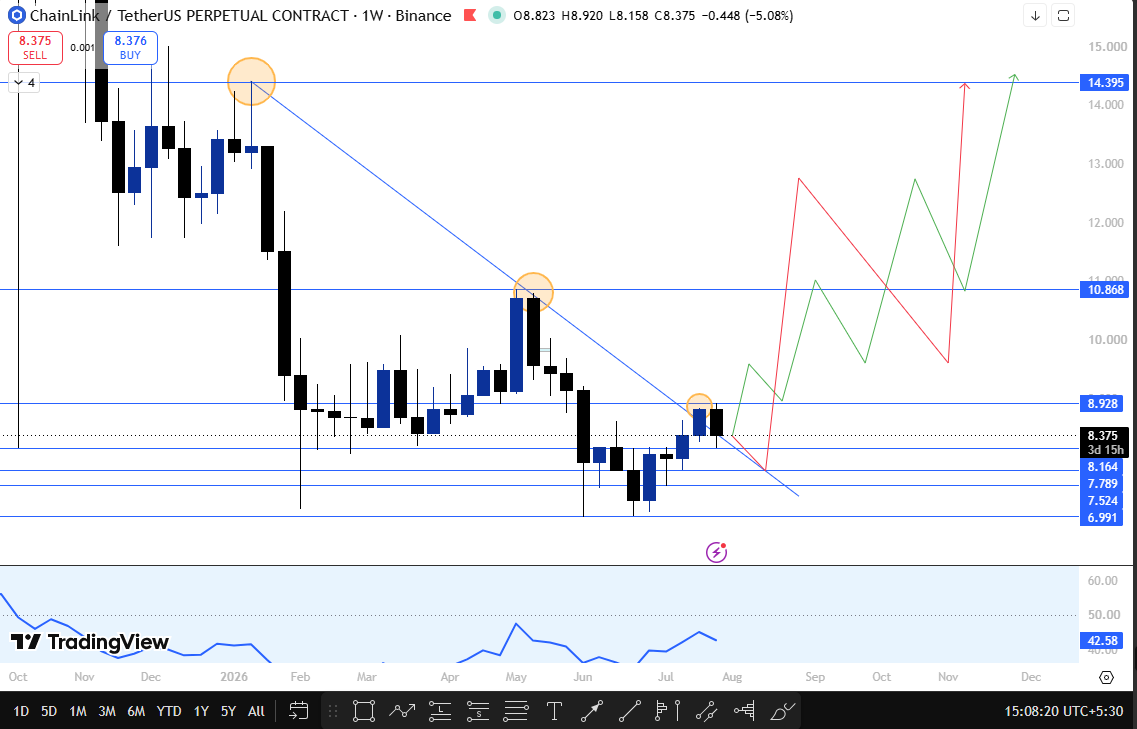
Price had been respecting a descending trendline, and the second tap of that line produced a lower low, but only on the wick and not on a closing basis, a setup close to the bear trap breakout pattern.
Since then, price has delivered a trendline break confirmation, closing above the line, and the following weekly candle swept liquidity to the upside before pulling back toward the lower body of that same candle, where it is trading now, a level worth keeping on trendline watch.
A weekly close above $8.928 would put $10.868 and then $14.395 on the table, while a close below $8.164 would send the price toward $7.789 and then $6.991.
Momentum readings support a cautiously improving picture without confirming it outright.
Technical Analysis: Key Support and Resistance Levels (Chainlink)
Timeframe | Resistance | Support | Trigger |
Daily | $8.515, $8.928-$9.312, $10.052 | $8.006, $7.789, $7.524 | Close above/below $8.515 / $8.006 |
Weekly | $8.928, $10.868, $14.395 | $8.164, $7.789, $6.991 | Close above/below $8.928 / $8.164 |
These levels are derived from previous swing highs and historical supply zones.
Chainlink Price Prediction for August 2026: Bull, Base, and Bear Cases
The base case has LINK continuing to consolidate between the $8.006-$8.164 support zone and the $8.515-$8.928 resistance zone through most of August, without a confirmed break either way.
The bull case activates on a daily close above $8.515, which opens $8.928-$9.312 and then $10.052, and strengthens further if the weekly candle closes above $8.928 for a run at $10.868 and $14.395, a case that gets extra support from the growing real-world demand for Chainlink's infrastructure described below.
The bear case needs a daily close below $8.006, keeping $7.789 and $7.524 in focus, and turns more serious on a weekly close below $8.164, which would expose $7.789 and then $6.991. Each scenario depends on a confirmed close on its own timeframe, not an intraday wick.
On-Chain and Fundamental Drivers (Chainlink)
The strongest fundamental signal for Chainlink right now is coming from real-world finance moving on-chain.
A market as large as U.S. auto lending routing through Chainlink's oracle and Data Streams infrastructure adds recurring, usage-based demand for the network, separate from short-term price speculation.
This is exactly the kind of adoption story that can pull fresh capital and attention toward LINK over time.
August 2026 Catalysts That Could Move Chainlink
The Figure and HastraFi integration on Kamino is the standout catalyst heading into August, putting Chainlink at the center of a trillion-dollar asset class entering DeFi for the first time.
If this kind of institutional-grade adoption keeps expanding, it strengthens the fundamental case behind any technical breakout, since real usage growth tends to support demand even during consolidation.
Beyond this, LINK will also take cues from the broader Bitcoin and Ethereum direction.
What Analysts Are Forecasting (Chainlink)
Sentiment is currently split between those reading the daily breakout and higher high as the start of a stronger move and those pointing to the still-soft weekly RSI as a reason to wait.
The Figure and HastraFi news add a fresh fundamental argument to the bullish side, but the chart still needs a weekly close above $8.928 before that view is fully validated.
Chainlink Long-Term Outlook: 2027 to 2030
A sustained break above the weekly resistance zone of $10.868 and $14.395 would meaningfully improve Chainlink's longer-term structure, and continued real-world asset integrations give that case more backing than the chart alone, a theme explored further in the LINK 2030 outlook.
The near-term path still depends on August's price action holding above the current range.
Risks That Could Invalidate This Forecast (Chainlink)
The bullish case fails if the daily chart cannot close above $8.515 and fails more decisively if the weekly candle closes below $8.164, which would open $7.789 and then $6.991.
Broader risks include shifts in Bitcoin dominance, macro liquidity conditions, and general crypto market volatility, any of which could override Chainlink's own setup regardless of where the trendlines sit.
How to Buy and Store Chainlink Safely
LINK can be bought on major exchanges that support spot and futures markets, then moved to a personal wallet for storage rather than left on an exchange long-term.
Hardware wallets are generally considered the safer option for holding larger amounts, and enabling two-factor authentication on any exchange account is a basic but important precaution.
Glossary
Ascending trendline: an upward-sloping line connecting a series of higher lows, used to track a prevailing uptrend
Higher high: a peak that forms above the previous peak, generally read as a sign of continuing upward momentum
Liquidity sweep: a fast move that clears out orders resting above or below a recent high or low before reversing
RSI (Relative Strength Index): a momentum indicator scaled 0-100, where readings below 50 suggest weaker momentum and above 50 suggest stronger momentum
Real-world asset (RWA): a traditional financial asset, such as a loan or bond, brought on-chain so it can be used in DeFi
Support: a price zone where buying pressure has previously stepped in
Resistance: a price zone where selling pressure has previously capped upside
Invalidation level: the price point at which a forecast scenario is considered incorrect.
Disclaimer
This article is for informational purposes only and does not constitute financial advice. Cryptocurrency markets are highly volatile, and all price levels discussed are based on technical chart analysis, not a guarantee of future performance. Readers should conduct their own research before making any investment decisions.
0
0

 Manage all your crypto, NFT and DeFi from one place
Securely connect the portfolio you’re using to start.


0
0


0
0