
Sui Price Prediction: $SUI Wedge Breakout Rally or Trap?

0
0

Sui just broke out of a multi-week falling wedge, and the move looks real. SUI is trading at $0.82791, down 3.43% today after pulling back from a sharp breakout candle.
This Sui Price Prediction looks at what that wedge breakout means and the levels standing between here and a much bigger move.
Market data checked on September 20, 2026.
Sui Price Prediction Today: Market Overview
Metric | Value |
Price | $0.82791 |
24h Change | -3.43% |
Daily Range | $0.80866 – $0.87056 |
SUI Technical Analysis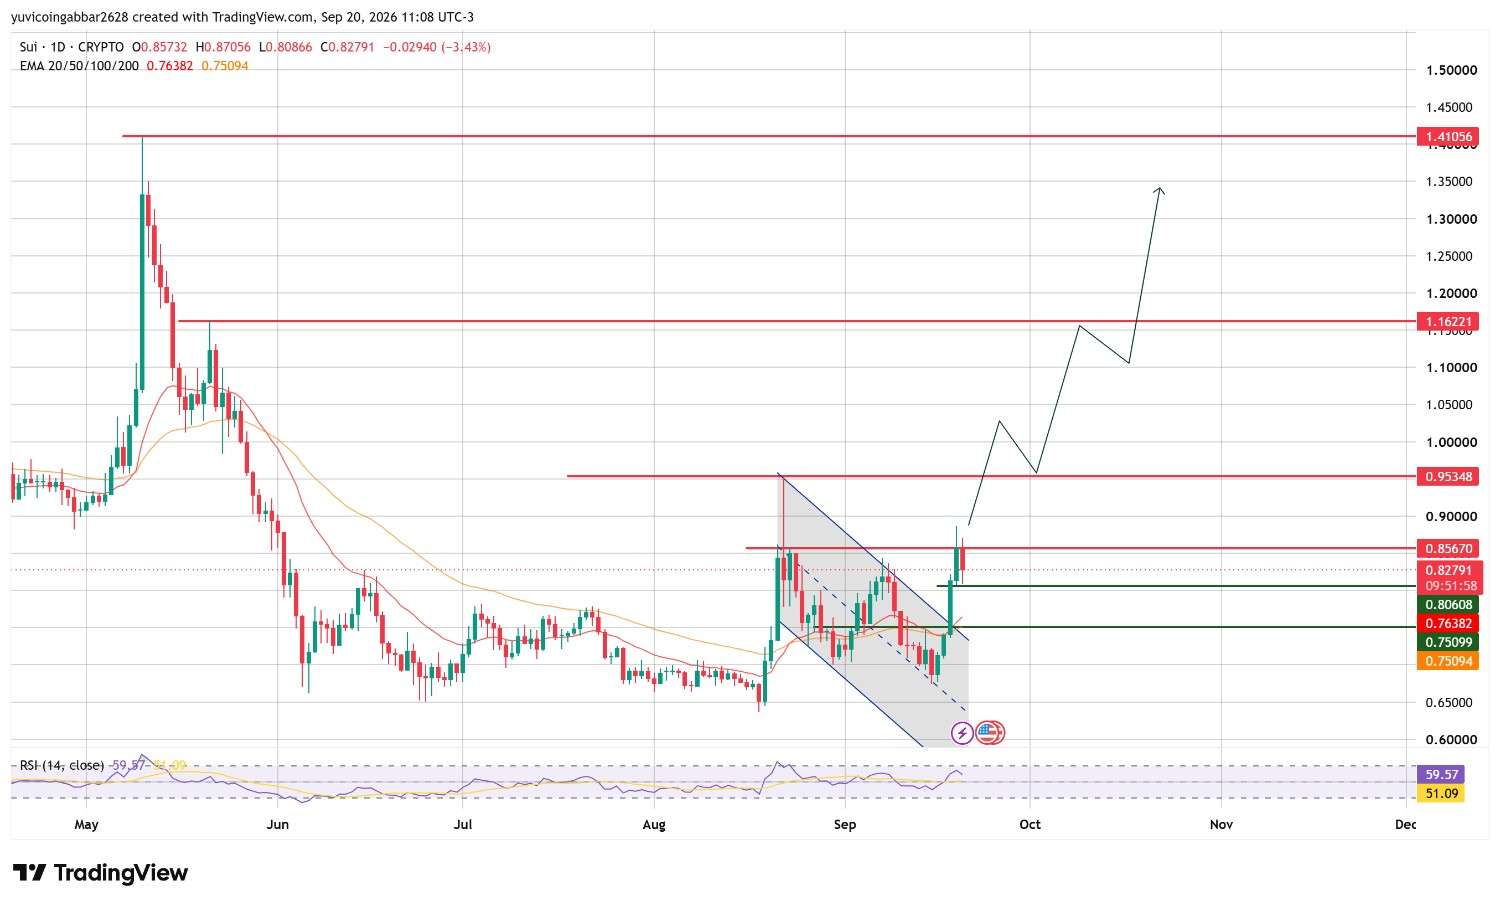
Since early September, SUI has been sliding inside a falling wedge, a pattern where price makes lower highs and lower lows that squeeze together over time, often a sign a downtrend is losing steam rather than continuing.
A few days ago, the price broke sharply above that wedge with a strong green candle, and it's now pulling back to retest the breakout zone, trading at $0.82791 after opening at $0.85732 and dipping to a low of $0.80866.
RSI, a momentum indicator that measures how fast and how far price has moved, sits at 59.57, above the neutral 50 line and cooling slightly from the breakout spike without turning weak.
The EMA cluster at $0.75094 to $0.76382 sits well below as deeper support, while $0.80608 marks the more immediate support right under the current breakout zone.
If SUI holds this breakout, the nearest resistance is $0.85670, right around current levels, followed by $0.95348. Much further out, the chart marks $1.16221 and $1.41056 as longer-term targets if the broader trend keeps building.
Support
$0.80608 is the first support to watch, just under the breakout zone. Below that, the EMA cluster near $0.75094 to $0.76382 marks deeper support.
Resistance
$0.85670 is the immediate resistance. Clearing it opens the path toward $0.95348, with $1.16221 and $1.41056 as much bigger targets further out.
Triggers and Invalidation
Scenario | Trigger | Likely Outcome | Invalidation |
Breakout holds | Hold above $0.80608, clear $0.85670 | Push toward $0.95348 | Close below $0.76382 |
Retest holds | Bounce from $0.80608 | Base before next leg up | Break below $0.75094 |
Breakdown | Close below $0.75094 | Wedge breakout fails | Reclaim $0.80608 |
Sui Price Prediction: Can Sui Reach $1.41?
That's the highest level marked on this chart, and it's a long-term target rather than something the current breakout alone supports.
SUI would need to clear $0.85670, $0.95348, and $1.16221 first, so treat it as a longer-horizon marker, not an immediate one.
Sui Price Prediction 2026: Expert View
According to CoinGabbar analysts, the wedge breakout is the key development here, a multi-week downtrend that finally broke to the upside with real conviction. $0.80608 is the level that decides what happens next: holding it during this retest would confirm the breakout is genuine, while losing it would put the whole move back in question.
Disclaimer
This article is for informational purposes only and isn't financial advice. Crypto markets are volatile. Always do your own research before making any trading decisions involving SUI.
0
0

 Manage all your crypto, NFT and DeFi from one place
Securely connect the portfolio you’re using to start.


