
SUI Price Prediction October 2026: Eyes $4 as Bullish Divergence Seen!

0
0

SUI jumped almost 90% from its mid-September low, then fell 6% today after touching $1.29.
This SUI Price Prediction October 2026 looks at whether $1.1328 holds and what the big price targets going around online really mean.
SUI News Today: Bullish Divergence
A trader's post said higher timeframe bullish divergences are playing out on SUI once again. A bullish divergence happens when price makes a lower low but an indicator, such as RSI (a tool that measures how fast price is moving), makes a higher low.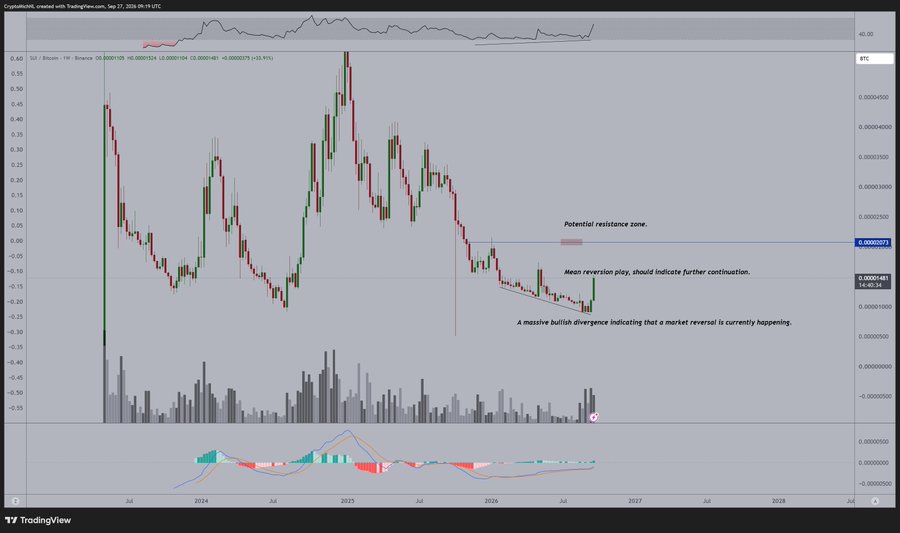
Source: Data From X
It suggests selling pressure is fading. The post did not show a chart or say which indicator or timeframe it used. CoinGabbar could not verify the claim from the post alone.
SUI News: Sui Community Shares Three Price Targets
Sui Community posted that SUI is "up from now" and listed three targets: $1.91, $3.68, and $4.28.
The post gave no reason or timeline for these numbers. They are the poster's view, not a forecast from CoinGabbar, and CoinGabbar could not independently verify them.
SUI Technical Analysis
SUI spent June, July and August in a slow sideways range between about $0.65 and $0.85. In mid-September it broke out.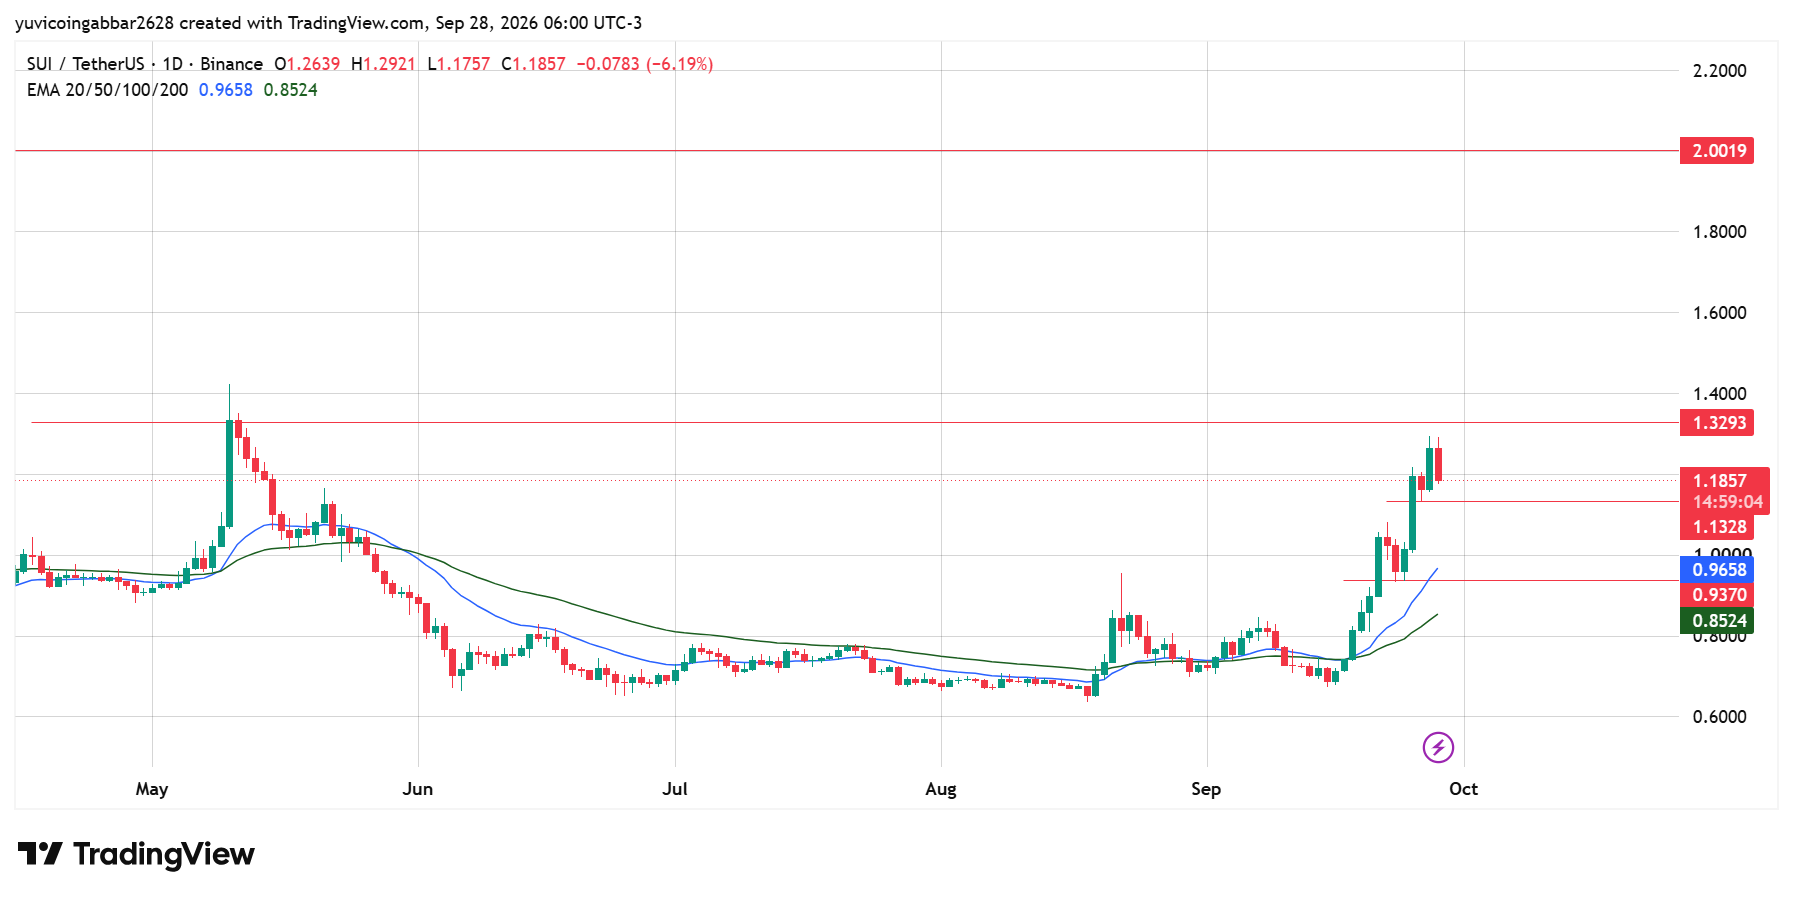
Price spiked in a run of big green candles and reached a high of $1.2921 on the latest sessions, close to the $1.3293 level, which is the high from May.
Today's candle is red. The price opened at $1.2639, fell as low as $1.1757, and closed near $1.1857. SUI Price Today is down 6.19%. That is a large drop, but it comes after a very fast climb, so some pullback is normal.
Two EMAs sit far below price. The 20 EMA is at $0.9658 and the 50 EMA is at $0.8524. Price is well above both, which shows the trend is up. It also shows price has moved far, and that gap often closes a little through a pullback.
The $1.1328 level is the next support below price. Under that is $0.9370, which sits just below the 20 EMA, so a drop there would test the whole breakout.
SUI Outlook: Support and Resistance Levels
Level Type | Price |
Resistance 2 | $2.0019 |
Resistance 1 (nearest) | $1.3293 |
Immediate Price Reference | $1.1857 |
First Confirmed Support | $1.1328 |
Deeper Support | $0.9370 |
EMA Support Zone | $0.9658 to $0.8524 |
SUI Price Forecast
Bull case: If the price holds $1.1328 and turns up, SUI could try $1.3293 again. A close above that level would clear the May high and open the way to $2.0019. A real bullish divergence, if it is confirmed, would add to this case.
Bear case: A close below $1.1328 would suggest the rally is losing strength. The next stop would be $0.9370, and a break there, along with a drop under the 20 EMA at $0.9658, would put the whole breakout at risk.
SUI Price Prediction October 2026: Can SUI Reach $4.28?
$2.0019 is the highest level marked on the chart, so the $3.68 and $4.28 targets from the post sit well above anything the chart shows.
To get near them, SUI must first clear $1.3293 and then $2.0019. The post gave no data to support the higher numbers, so treat them as opinion.
SUI Price Prediction: Expert View
According to CoinGabbar analysts, the move from $0.65 to $1.29 was fast, and a 6% pullback after it is not a surprise. The chart is still in an uptrend with the price above both EMAs.
The level to watch is $1.1328, because a close below it would be the first sign that the rally is tiring.
Disclaimer
This piece is for informational purposes only and isn't financial advice. The levels and scenarios above are based on technical chart analysis and publicly available data at the time of writing. Crypto markets can move sharply within hours, so past patterns don't guarantee future outcomes. Do your own research and consider your risk tolerance before acting on any level discussed here.
0
0

 Manage all your crypto, NFT and DeFi from one place
Securely connect the portfolio you’re using to start.


