
VeChain Price Prediction October 2026: Can VET Break $0.0099?

0
0

VeChain (VET) trades at $0.008865 on October 1, 2026, down 1.24% in 24 hours. The 100-period EMA, a moving average weighting recent prices, sits just below at $0.008622.
This VeChain price prediction maps October 2026 scenarios from sourced data. Earlier VeChain channel reclaim levels coverage adds context.
Snapshots below carry a timestamp of about 09:30 UTC on October 1, 2026.
$VET Price Today on CoinMarketCap
VeChain ranks #74 on CoinMarketCap data, priced at $0.008865. That's a 1.24% drop in 24 hours.
The 24-hour range spans $0.008763 to $0.009206.
$VET Market Cap and Supply
Market cap, price multiplied by circulating supply, stands at $762.34M. Fully diluted valuation (FDV), which assumes maximum supply exists, reads $768.79M.
Circulating supply is 85.98B VET against an 86.71B maximum. That's 99.2% in circulation.
$VET All-Time High and Low
$VET peaked at $0.2782 on April 17, 2021. The price now sits 96.81% below that level.
The all-time low of $0.001678 arrived on March 13, 2020, and the price trades 428.34% above it. Coverage of the VET historic move adds to the longer cycle.
$VET Trading Volume
Trading volume reached $14.4M over 24 hours, down 2.91%. That equals 1.89% of market cap.
Turnover that thin gives any move limited confirmation. A VET volume surge above $14.4M would add some.
$VET Derivatives Data
Futures volume hit $28.75M.
Open interest, the value of outstanding contracts, stands at $37.99M.
Spot volume on CoinGlass spot data reads $4.78M. Futures trade about 6 times that.
CoinMarketCap reports $14.4M in spot volume, likely because exchange coverage and update times differ.
VET Long/Short Ratio and Liquidations
The long/short ratio tracks positions betting on gains versus declines. Binance VET/USDT shows 1.3691 by accounts.
Top traders post 1.9369 by accounts and 2.6913 by positions. Readings above 1.0 mean longs outnumber shorts.
And liquidations stayed light at $32.23K over 24 hours, split between $16.93K long and $15.30K short. Crowded longs add liquidation risk if $0.008622 fails.
$VET Price Performance Across Timeframes
CoinGlass shows VET up 0.51% over 7 days, 31.74% over 30 days, and 90.61% over 90 days.
But the 1-year reading is -59.29%, and year-to-date it sits at -15.09%.
Recovery from the $0.004256 low hasn't erased those losses. More crypto price predictions cover other tokens.
VeChain Technical Analysis on the 4-Hour Chart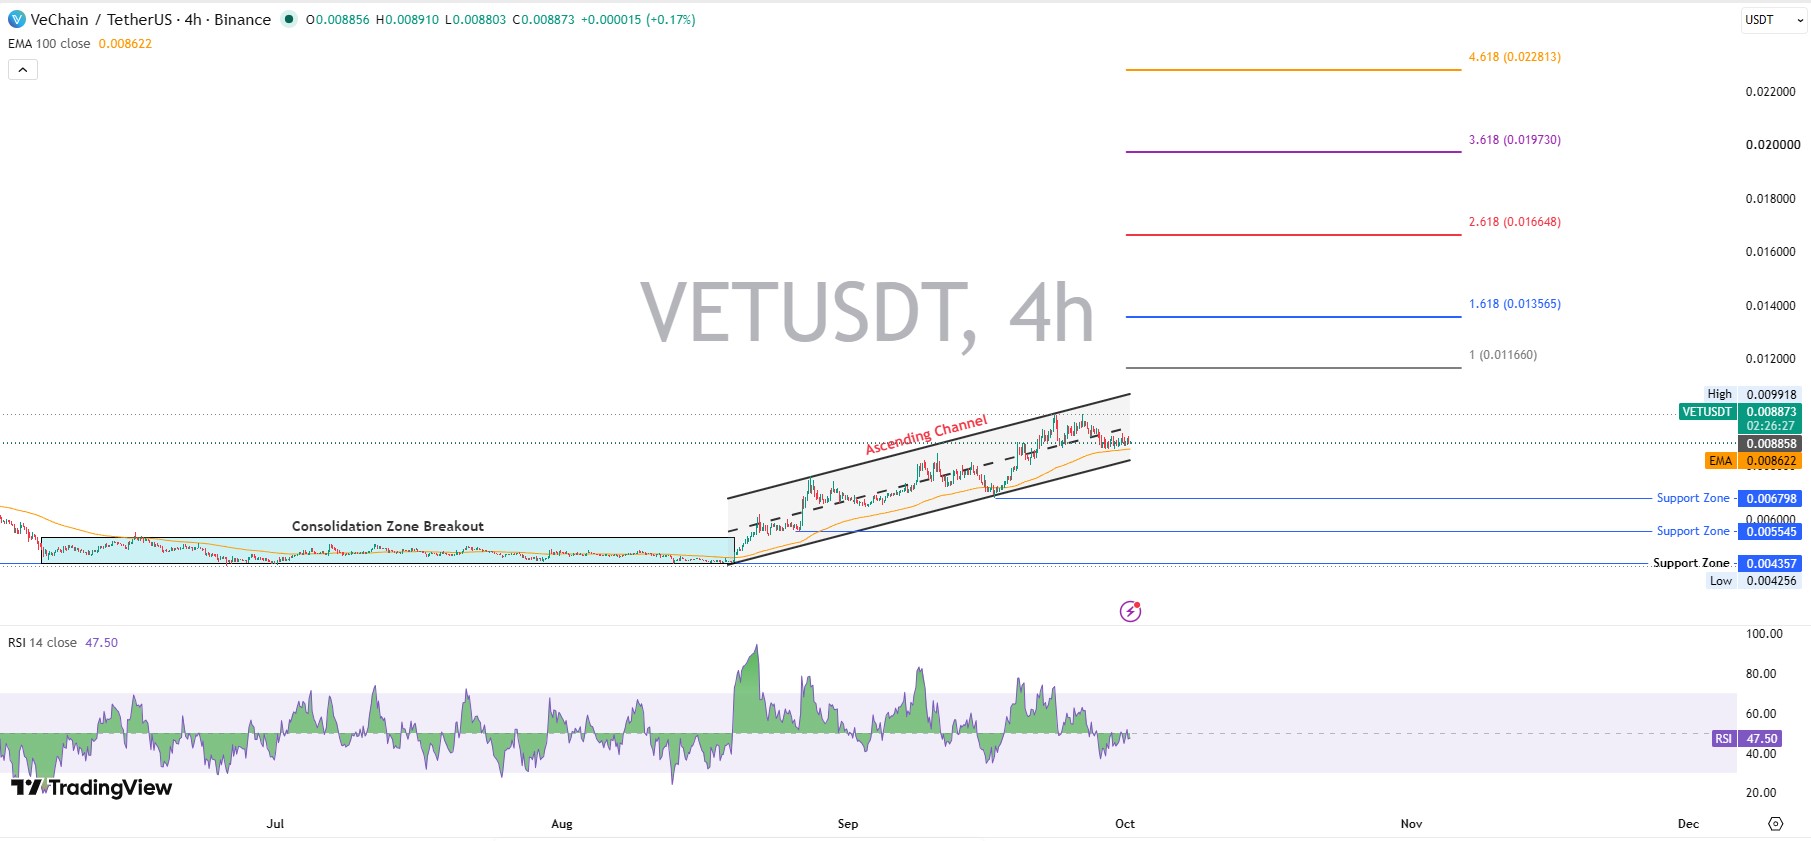
VeChain technical analysis on the VETUSDT 4-hour chart at Binance shows an ascending channel, a pair of rising parallel trendlines. It formed after an August breakout from a consolidation zone near $0.004357.
Price topped at $0.009918 in late September. As of 09:30 UTC, the latest 4-hour candle traded between $0.008803 and $0.008910.
But the pullback hasn't broken the channel, and the price remains above the 100-period EMA at $0.008622.
Chart data comes from TradingView charts.
$VET RSI Analysis
$VET RSI, It reads 47.50 on the 4-hour chart, inside the neutral 30 to 70 band.
RSI topped 90 during the August breakout.
Neutral, at a glance. Except readings under 50 tilt toward sellers.
Can buyers lift RSI above 60 before the EMA gives way?
VET MACD Analysis
$VET MACD subtracts a 26-period EMA from a 12-period EMA. The MACD line reads -0.000054, the signal line -0.000068, and the histogram +0.000014.
$VET Support and Resistance Levels
VET support and resistance levels come from the TradingView chart and CoinMarketCap's 24-hour range. Support marks zones where buyers have stepped in, and resistance marks where sellers have.
Fibonacci extensions project levels beyond a prior move. Earlier analysis of VET support after drop covers the lower zones.
Level | Price | Type |
Fibonacci 1.0 | $0.011660 | Resistance |
Swing high | $0.009918 | Resistance |
24-hour high | $0.009206 | Resistance |
100-period EMA | $0.008622 | Support |
Support zone | $0.006798 | Support |
Support zone | $0.005545 | Support |
Support zone | $0.004357 | Support |
VeChain Price Prediction October 2026: Bull Case
A sustained trade above $0.009918 on rising volume. That opens at $0.011660, up 31.5% from $0.008865, and a market cap near $1.00B.
Supporting conditions include RSI above 60 and a MACD cross above 0. Invalidation sits at $0.008622.
The next extensions sit at $0.013565 and $0.016648. Catalysts in the coin events calendar could supply volume.
VeChain Price Prediction October 2026: Base Case
Range trading between $0.008622 and $0.009918 fits current data through early October 2026. RSI at 47.50 and a 7-day change of 0.51% support that range.
Attention rotating to crypto airdrops and new listings could keep volume near $14.4M. And a sustained break of either boundary ends the range.
VeChain Price Prediction October 2026: Bear Case
Below $0.008622 and the channel's lower boundary. That exposes $0.006798, a 23.3% drop from $0.008865.
Deeper support sits at $0.005545 and $0.004357. But weak volume and long-heavy positioning raise that risk, and reclaiming the EMA invalidates it.
$VET Market Context
Capital flowing to newer launches, tracked in presale and ICO listings, can thin liquidity for established tokens such as VET.
What Could Change the $VET Price Prediction
Any $VET price prediction depends on volume and momentum.
A trade below $0.008622 would favor the bear case. Sector headlines in AI crypto news add outside catalysts.
$VET Price Risks
Futures positioning leans long, so a drop through $0.008622 could trigger liquidations.
Broad sentiment shifts, covered in memecoin crypto news, can override chart levels.
Disclaimer: This article provides information only and isn't financial advice. Crypto assets are volatile, and technical indicators don't guarantee outcomes. Readers should verify live data before any decision.
0
0

 Manage all your crypto, NFT and DeFi from one place
Securely connect the portfolio you’re using to start.


