
Ethereum Price Prediction July 2026: The Level That Decides Next Move

0
0

Ethereum Price Eyes Breakout But $1,700 Correction Risk Looms
Ethereum is facing resistance from the psychological $1,850 level, along with a descending trendline, as Iran has vowed to retaliate against the latest U.S. strikes.
At 5 p.m. ET today, U.S. Central Command forces began launching more strikes against Iran to continue degrading the country's ability to attack civilian mariners and commercial ships freely transiting the Strait of Hormuz.
The Commander in Chief has directed the strikes to hold Iranian forces accountable.
Let's discuss the Ethereum Price Prediction July 2026
What is Ethereum's price today?
ETH is changing hands around $1,775 to $1,780, down close to 1.71% over the past 24 hours.
Futures volume over the last day sits near $31.33 billion, up 25% from the prior session.
Open interest slipped 1.58% to $24.30 billion, while options open interest rose 1.30% to $4.36 billion.
The Binance long/short ratio by accounts reads 1.8369, and OKX shows 1.47, meaning more traders are still positioned long even after the pullback.
Will Ethereum's July monthly close decide its next trend?
$ETH's July monthly close could decide the next major trend for the asset.
If ETH closes July above $2,050, some traders are targeting $4,000 and above, along with a new all-time high this cycle.
If it fails to reclaim and close above $2,050, a deeper correction toward the $1,300 to $1,000 demand zone remains possible before the next major expansion. The monthly close will likely define Ethereum's next macro trend.
How many traders got liquidated in the past 24 hours?
According to CoinGlass data, 67,396 traders were liquidated in the past 24 hours, with total liquidations coming in at $238.40 million.
The largest single liquidation order happened on Hyperliquid, the XYZ:SKHX-USD pair, valued at $4.86 million.
Four-hour liquidation data for ETH shows $27.55 million wiped out, split between $24.73 million in longs and $2.81 million in shorts, a sign that leveraged long positions have taken the bigger hit recently.
$ETH will be bullish if it breaks $1,850.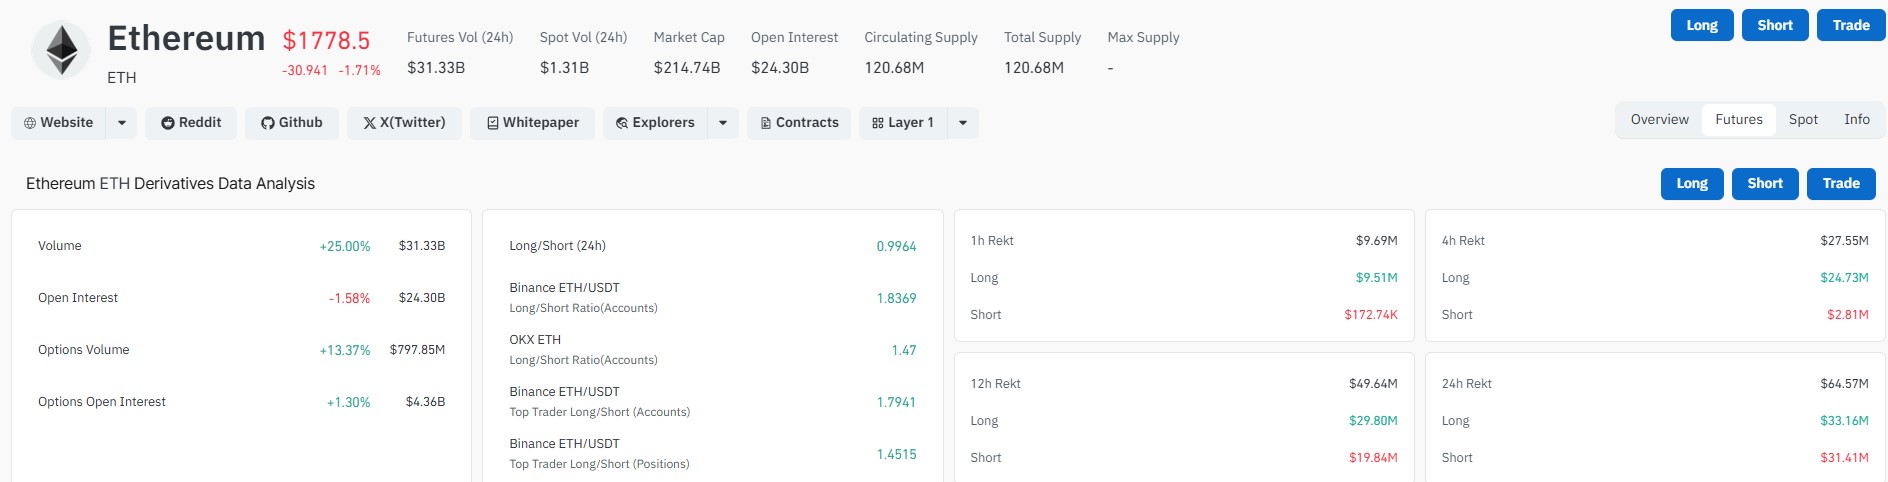
Is Robinhood about to pump the price of ETH?
The immediate success of Robinhood's new Layer 2 network is widely documented.
However, what is less discussed is the fact that Robinhood Crypto uses Ethereum's native token for gas fees, something Token Terminal believes could become a meaningful new source of demand for ETH.
DeFiLlama data also shows Ethereum app revenue hit $1.52 million on July 10, alongside 547,953 active addresses, both pointing to rising on-chain activity even as price consolidates.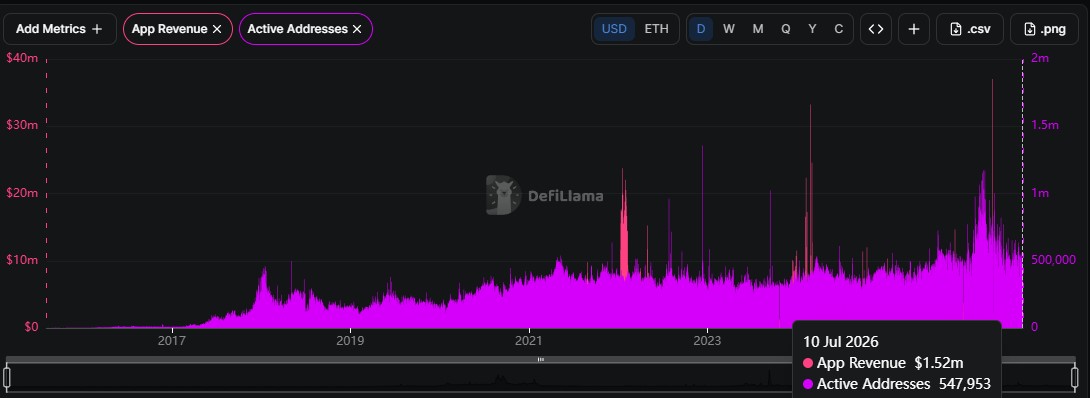
What is the key resistance and support for ETH right now?
Based on the daily chart, Ethereum is trading inside a consolidation pattern. A long-term descending trendline caps price on the upside, while a rising trendline near $1,500 continues to provide support.
Price is currently hovering around $1,780 after recovering from the June low, and buyers have managed to reclaim the short-term support zone.
The RSI sits near the neutral 52 to 54 level, indicating bullish momentum is slowly improving but has not yet confirmed a breakout.
Scenario | Key Level | Next Target |
Bullish breakout | Close above $1,820 - $1,850 | $2,000, then $2,300 - $2,400 |
Rejection at trendline | Fails at resistance | $1,650 - $1,700 support retest |
Bulls lose control | Breaks below $1,500 | Deeper correction toward $1,300 - $1,000 |
If ETH breaks and closes above the descending trendline and the $1,820 to $1,850 resistance zone, the pattern could trigger a bullish breakout, opening the door for a move toward $2,000, followed by $2,300 to $2,400, where the next major supply zone is located.
However, if sellers reject the price at the trendline once again, ETH could revisit the $1,650 to $1,700 support area, with $1,500 remaining the key level that bulls must defend to keep the broader recovery structure intact.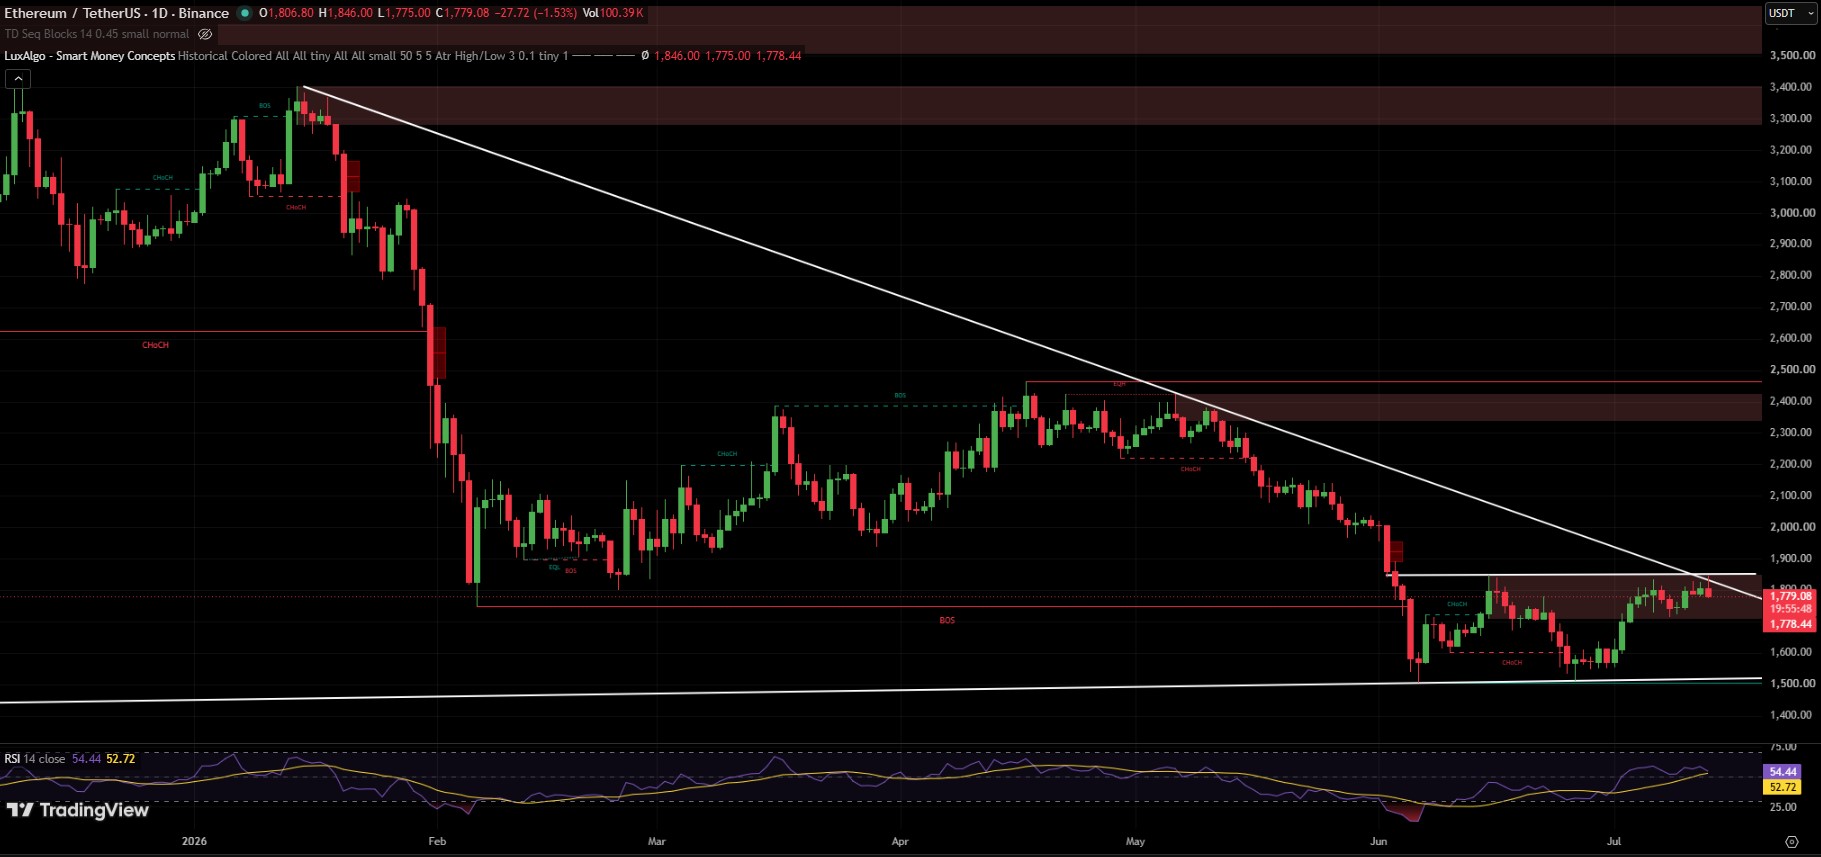
What does the ETH 4-hour chart show?
The 4-hour chart shows Ethereum recovering sharply from lows near $1,560 in late June, climbing back through $1,880 and toward the $2,111 region marked on the chart.
That move has erased much of the drawdown from the earlier $2,100 to $1,600 range seen across June and July.
Until a confirmed breakout or breakdown occurs, the pattern suggests consolidation with a slight bullish bias.
Ethereum Price Prediction July 2026: What's next?
The Ethereum price prediction July 2026 outlook hinges largely on the monthly close and how price behaves near $1,850.
A confirmed close above that zone opens the door toward $2,000 and beyond. A rejection keeps $1,650 to $1,700 in play, with $1,500 as the level bulls cannot afford to lose.
Disclaimer
This article is for informational purposes only and should not be considered financial or investment advice. Cryptocurrency markets are highly volatile and unpredictable. Always do your own research and consult a licensed financial advisor before making any investment decisions. Past performance is not indicative of future results.
0
0

 Manage all your crypto, NFT and DeFi from one place
Securely connect the portfolio you’re using to start.


0
0

0
0

0
0