Daily Market Review: BTC, ETH, SUI, ICP, HBAR
7d ago•

bullish:
0
bearish:
0
Share

Today’s market session has bulls on the front foot as seen from the increase in the global market cap. The total cap stood at $2,37T as of press time, representning a 1.5% increase over the last 24 hours. The trading volume stood at $84.5B as of press time, representing an 11% increase over the same period.
Bitcoin Price Preview
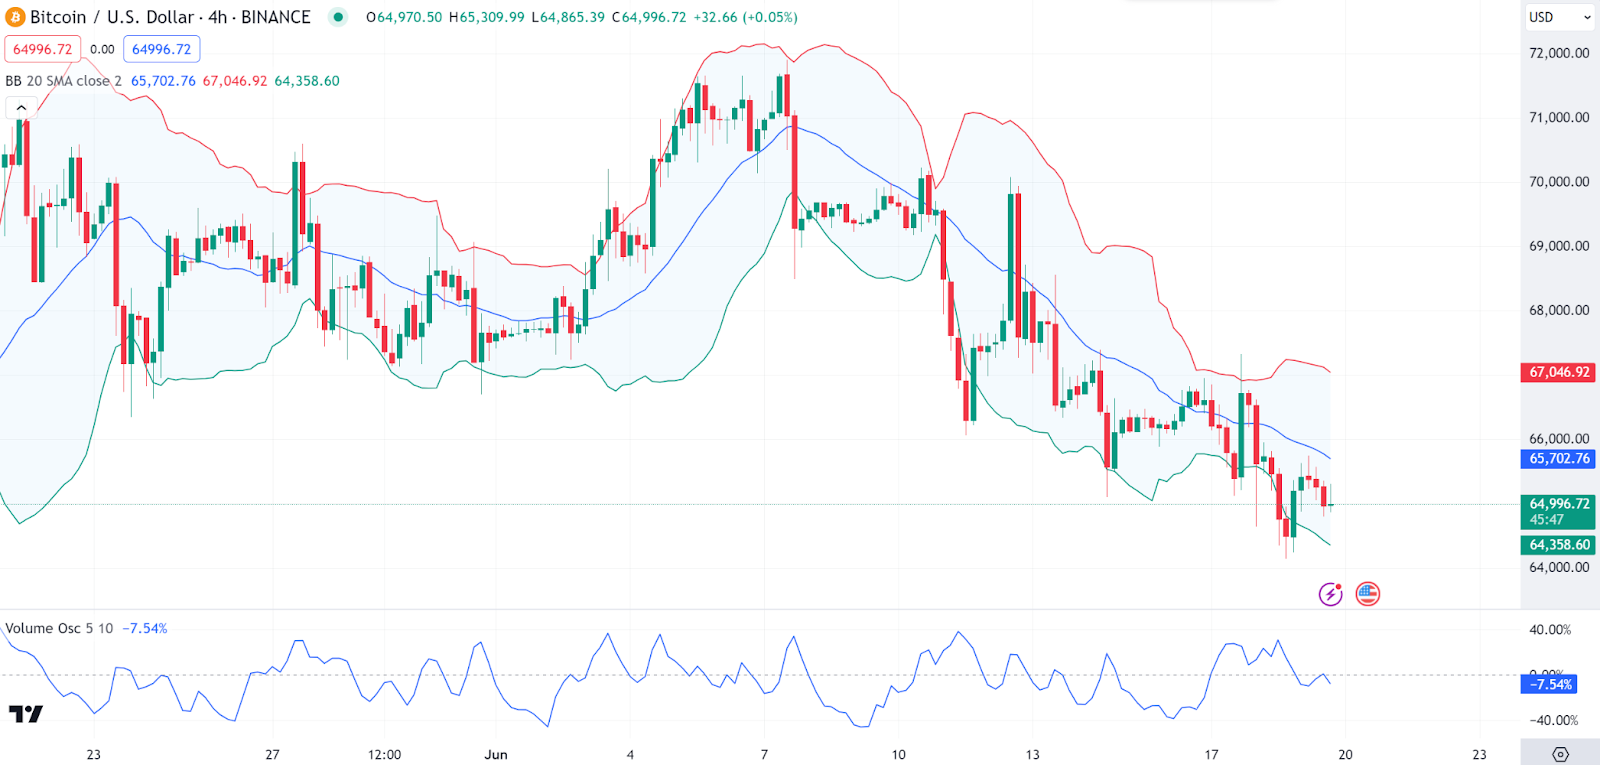
Bitcoin (BTC) is among the gainers in today’s session as seen from its price moevements. Looking at an in-depth analysis, we see that the Bollinger Bands indicate increased volatility, with price currently near the lower band, suggesting potential oversold conditions. The recent price action shows a downtrend, but the last few candles hint at a possible consolidation or minor rebound.
On the other hand, we see that the Volume Oscillator shows decreasing volume, suggesting weak momentum. As of press time, *BTC* was trading at $64,793, representing a 0.57% increase over the the last 24 hours.
Ethereum Price Review
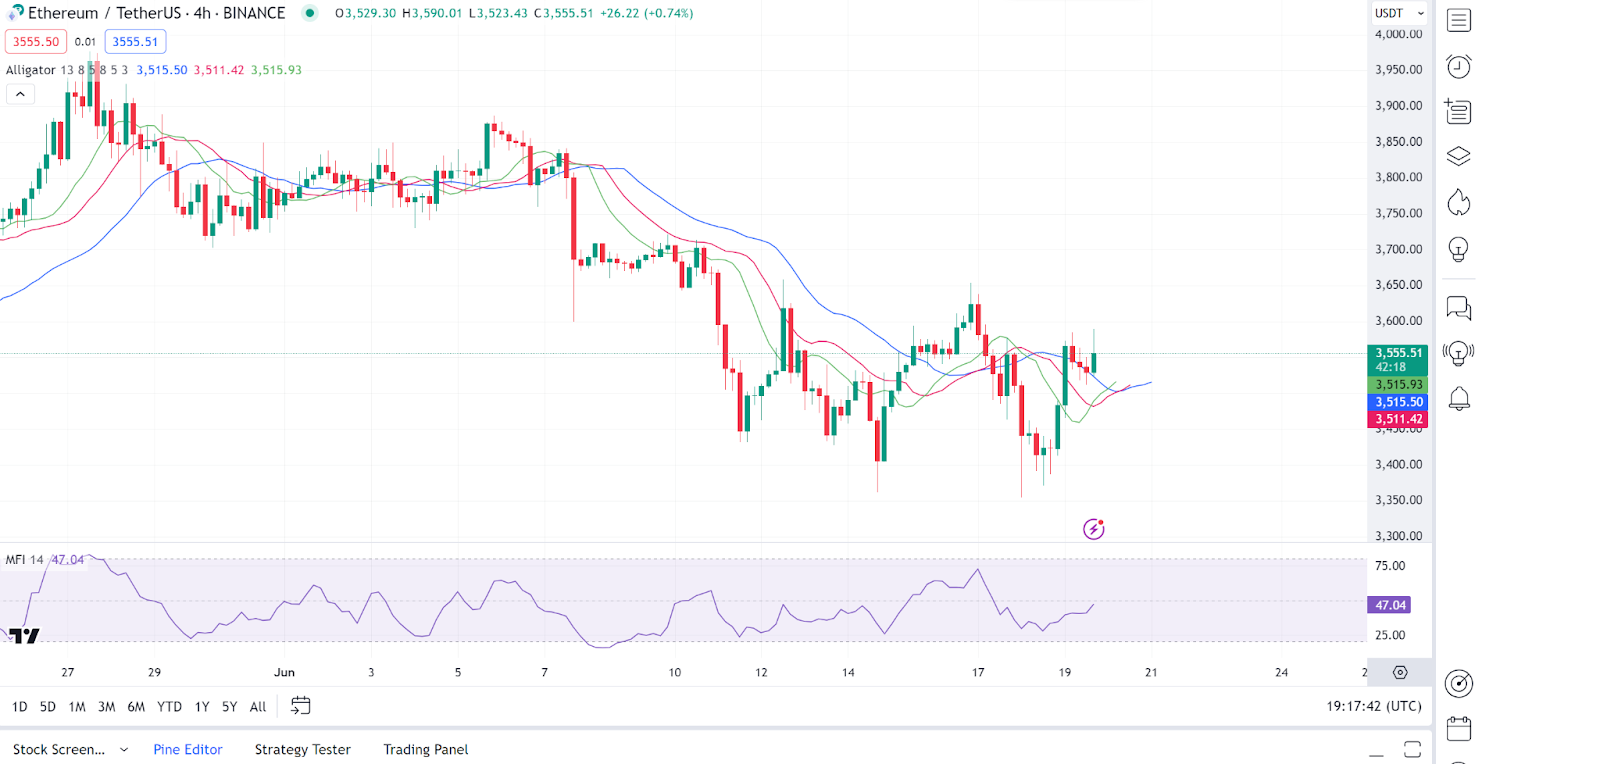
Ethereum (ETH) is also another gainer in today’s session as seen from its price movements. Analysing ethereum price charts, we see that the Alligator indicator shows the lines intertwined, indicating a potential trend change or consolidation phase. The *ETH* price is testing the middle band, with slight bullish candles forming.
On the other hand, we see that the Money Flow Index (MFI) is at 47, suggesting neither overbought nor oversold conditions, indicating indecision in the market. As of press time, Ethereum was trading at $3,542, representing a 4.5% increase over the the last 24 hours.
SUI Price Review
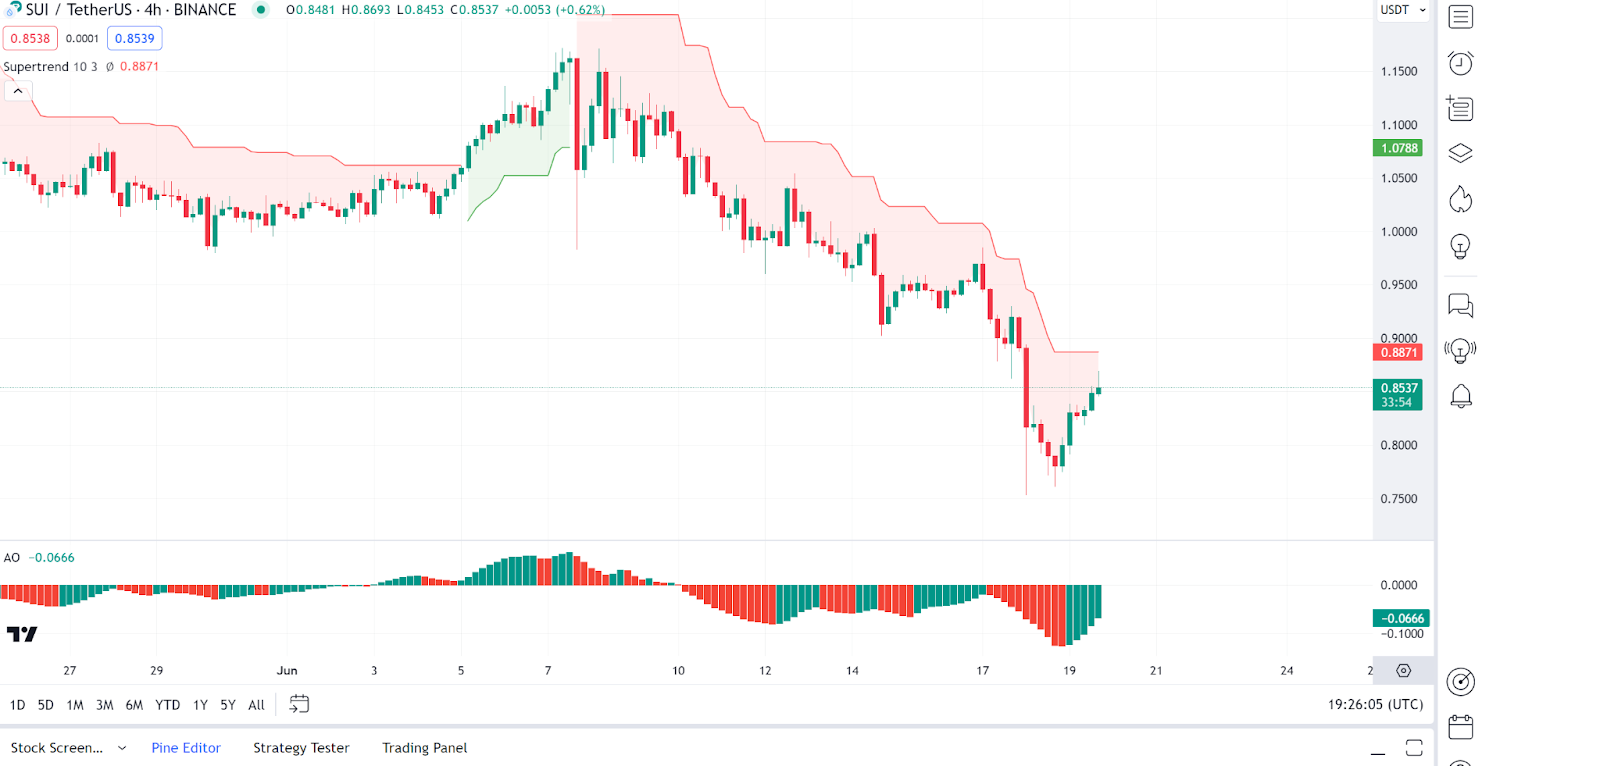
SUI (SUI) is also another gainer in today’s session as seen from the price moevemnts as well. Looking at an in-depth analysis, we see that the Supertrend indicator shows a bearish trend but is currently being tested, suggesting potential for reversal.
On the other hand, we see the recent price action shows a bounce from lows, but the overall trend remains bearish. On the other hand, the Volume has slightly increased, indicating some buying interest. As of press time, SUI was trading at $0.8596, representing a 10.7% increase over the the last 24 hours.
Internet Computer Price Review
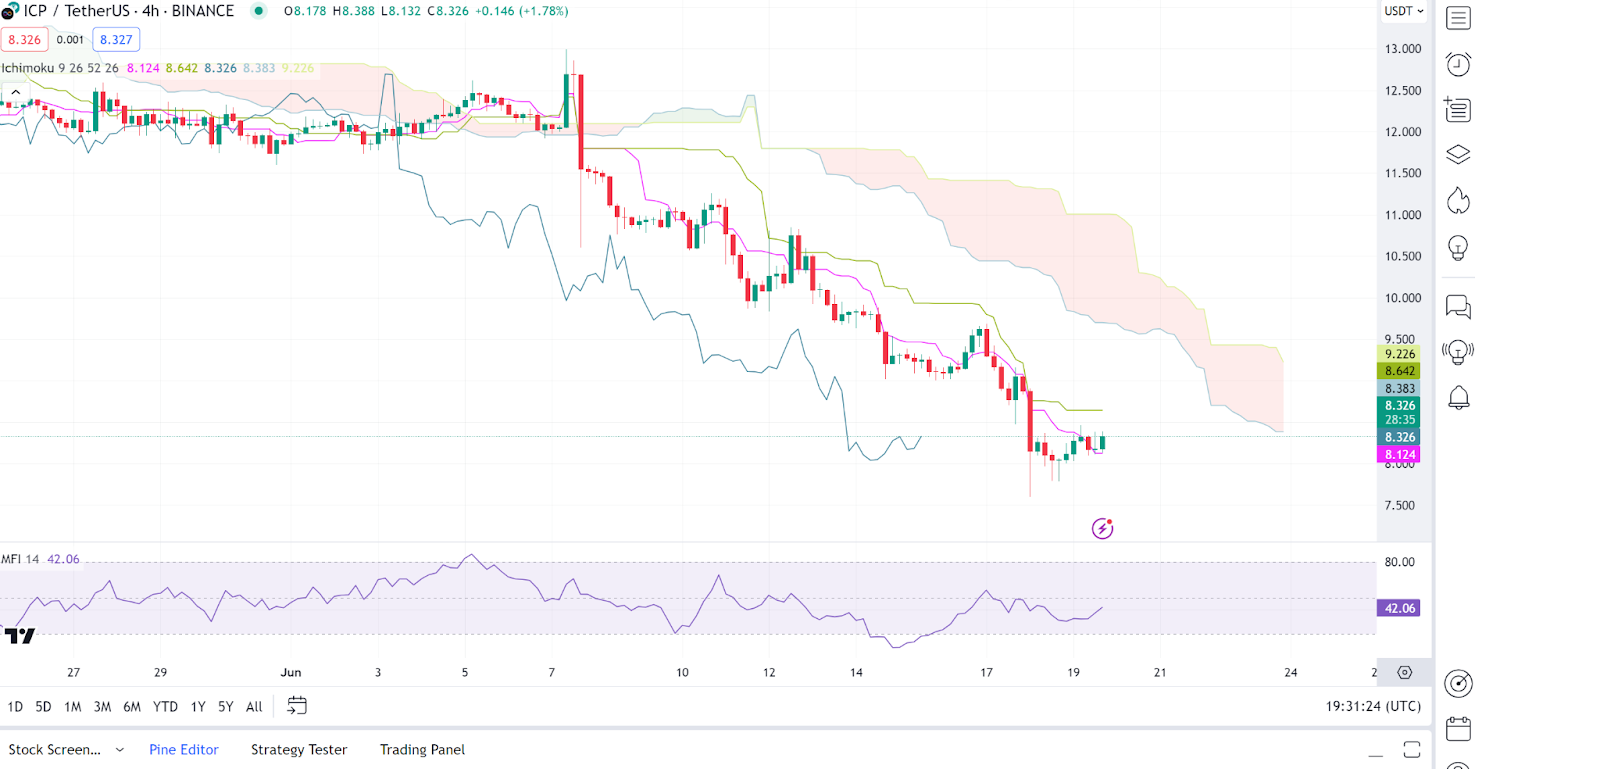
Internet Computer (ICP) is also another gainer in today’s session as seen from its price movements. Looking at an in-depth analysis, we see that the Ichimoku Cloud indicates bearish sentiment as price remains below the cloud. The conversion line crossing above the base line may signal a potential bullish reversal.
On the other hand, the MFI at 42 shows mild buying pressure, but the overall trend remains downward. As of press time, Internet Computer at $8.35, representing a 4.35% increase over the the last 24 hours.
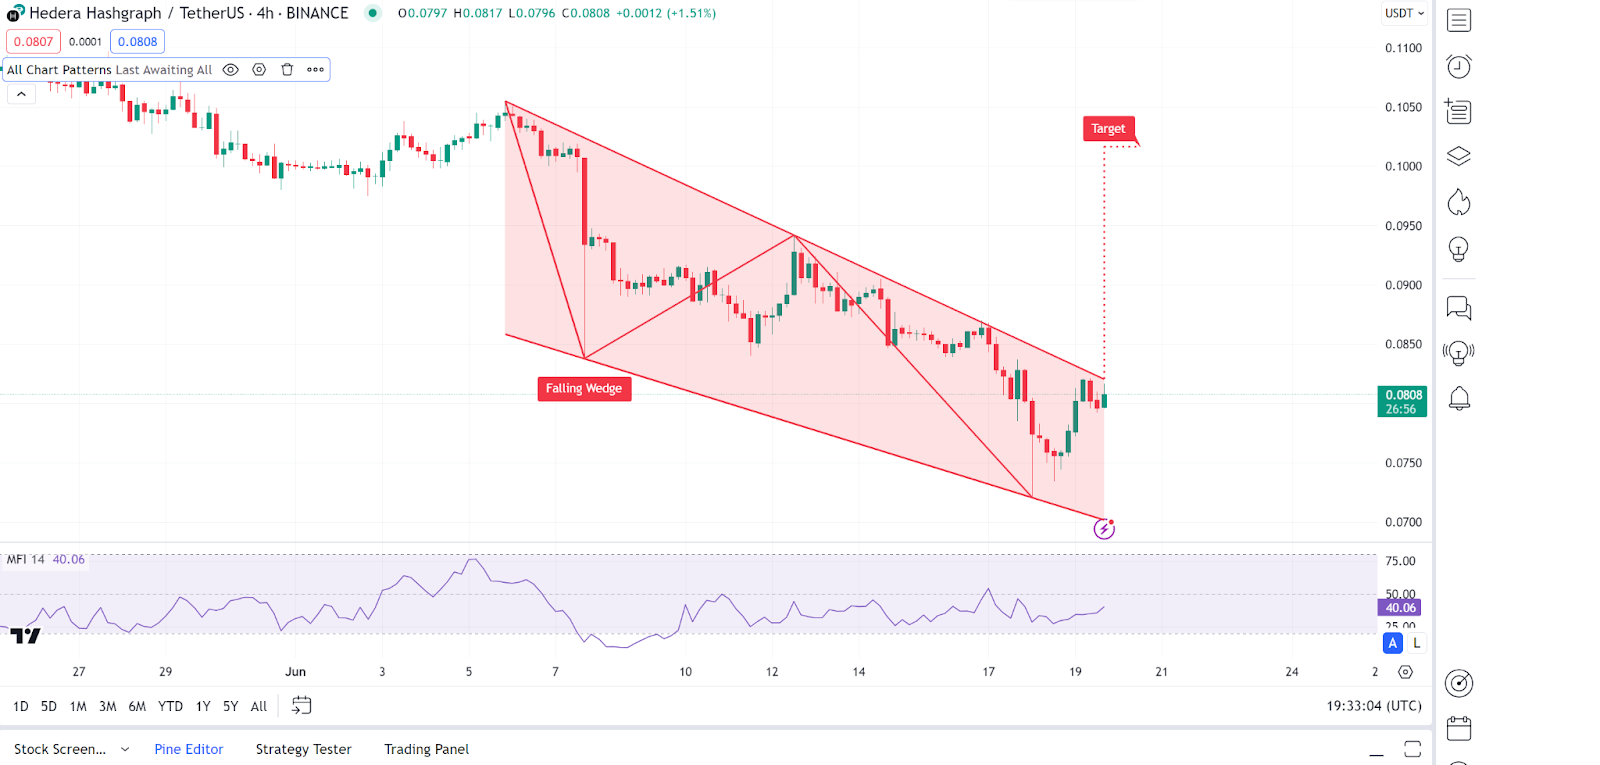
Hedera Price Review
Hedera (HBAR) is a gainer in today’s session as seen fro its price movements. Looking at an in-depth analysis, we see that the Falling Wedge pattern suggests a bullish reversal potential.
Price is nearing the resistance of the wedge, indicating a breakout might be imminent. On the other hand, the MFI at 40 suggests slight accumulation but no strong buying pressure yet. As of press time, Hedera at $0.08057, representing a 6.35% increase over the the last 24 hours.
7d ago•
bullish:
0
bearish:
0
Share

 Manage all your crypto, NFT and DeFi from one place
Securely connect the portfolio you’re using to start.

bullish:
0
bearish:
0

bullish:
0
bearish:
0

bullish:
0
bearish:
0
