
Stable Price Prediction: Is STABLE Ready for Its Next Big Move?

0
0

This STABLE price prediction starts with today's number: STABLE is down 7.3%, trading at $0.03843.
Notable drop for a token tied to Stable, the Bitfinex-backed, Tether-advised Layer 1 blockchain that runs on USDT as its gas token STABLE itself is the network's governance and security token, not a stablecoin, and it launched alongside StableChain's mainnet.
Two chart structures are building at once right now: an ascending channel on the 4-hour chart and a symmetrical triangle on the daily, carrying a Fibonacci-derived upside target well above current price.
Which one wins comes down to the levels below, and there's a holder concentration number worth understanding before reading too much into either pattern.
STABLE Price Snapshot (July 24, 2026)
| Metric | Value |
| Price | $0.03843 |
| 24h Change | -7.3% |
| BTC-Quoted Change (24h) | -6.5% |
| 24h Range | $0.03756 – $0.04152 |
| $951.795M | |
| Fully Diluted Valuation | $3.843B |
| 24h Trading Volume | $11.038M |
| Circulating Supply | 24.769B STABLE |
| Total Supply | 100B STABLE |
| Max Supply | 100B STABLE |
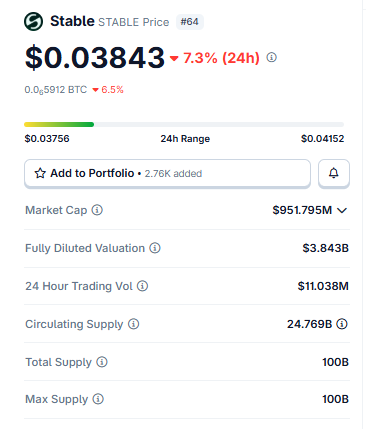
Data source: exchange market page from coingecko, reviewed July 24, 2026. Recheck these figures if STABLE trades outside the $0.025066–$0.053774 range referenced in this article, since that would move the price beyond every level discussed below.
STABLE's circulating supply sits at roughly 25% of its 100B max supply, which is standard for a newly launched network token still working through its unlock schedule worth keeping in mind alongside the FDV figure, which at $3.843B is about four times today's market cap.
What Is STABLE, Briefly
STABLE is the native token of Stable, often called StableChain, an EVM-compatible Layer 1 blockchain backed by Bitfinex and built around USDT as its transaction gas token, rather than a volatile native coin.
Tether CEO Paolo Ardoino has served as a close advisor to the project since its early stealth phase, and the network has since announced integrations with institutional partners including PayPal and Anchorage Digital.
STABLE itself is designed for governance and network security under a Delegated Proof-of-Stake model; actual payments on the chain continue to settle in USDT, not STABLE.
That context matters for reading this prediction: STABLE's price action reflects speculation on the network's native asset, not stablecoin-style price stability.
Liquidation Data
The dollar amounts on STABLE's liquidations are small, which tracks with a lower-liquidity token, but the pattern still says something. Over the last hour, $3.96 got liquidated, all of it shorts.
The 4-hour window leans the same way: $67.27 total, entirely shorts again, both consistent with STABLE's recent intraday bounce off its lows, squeezing anyone positioned against the move.
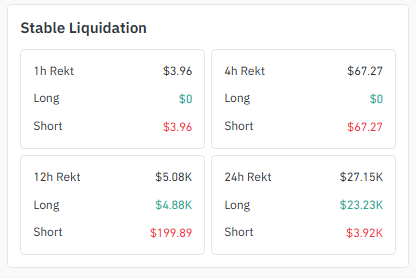
Source: Liquidation data taken from Coinglass.
Pull back to 12 hours, though, and it flips hard: $5.08K liquidated, with $4.88K of that from longs and just $199.89 from shorts, pointing to the sharper part of today's 7.3% drop catching over-leveraged bulls off guard.
Across the full 24 hours, the total sits at $27.15K, split $23.23K long versus $3.92K short so the bigger picture over the whole day still favors longs eating the pain, even with the last couple hours swinging back toward squeezing shorts instead.
Exchange Volume Heatmap
Trading activity on STABLE runs through Binance first, at $9.86M in futures volume, then BingX at $6.89M, OKX at $4.26M, and Bybit at $3.75M. 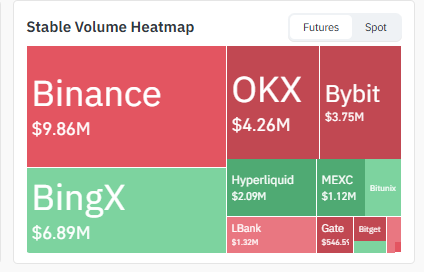
Source: Volume Heatmap data taken from Coinglass.
Hyperliquid adds $2.09M, LBank $1.32M, and MEXC $1.12M, with Gate at $546.51K and small slivers on Bitunix and Bitget rounding things out.
All of that against a $951.795M market cap is thin, and an $11.038M daily figure means liquidity here is fairly shallow for a token this size, which is part of why price can move sharply on comparatively small order flow.
Holder Concentration: An Extremely Early-Stage Distribution
[DATA SOURCE: STABLE On-Chain Holder Analytics]
This is the number that matters most for a token this new, and it's worth noting these figures reflect share of total supply, not USD market-cap value, per the on-chain source used.
The top 100 wallets hold 99.80% of the total supply, among the highest concentration levels seen in recent CoinGabbar coverage, well past what showed up recently in DOGE, UNI, or SHIB. 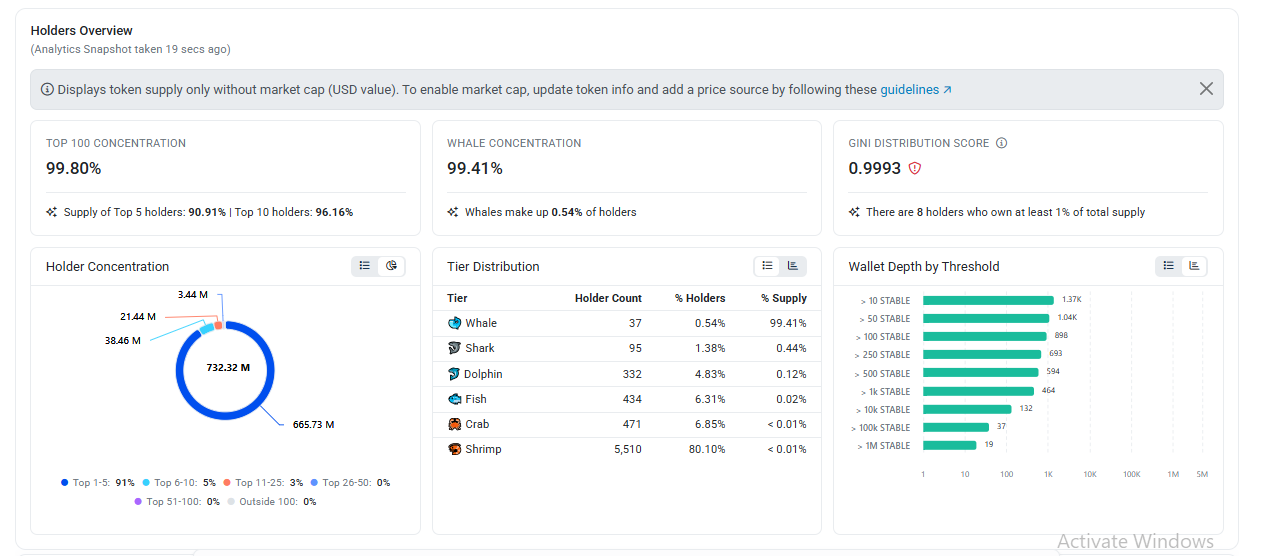
Five wallets alone hold 90.91% of the supply; the top 10 hold 96.16%. Whale concentration sits at 99.41% of supply, from wallets that make up just 0.54% of all holders.
Gini score: 0.9993, about as concentrated as this measure realistically gets.
By tier, 37 whale wallets control that 99.41%, while 5,510 shrimp-tier wallets, by far the biggest group by headcount, make up 80.10% of all holders but under 0.01% of supply combined.
Eight separate addresses individually own at least 1% of total supply.
This kind of concentration is fairly normal for a token in its first weeks post-launch, before wider distribution through exchanges and staking has had time to play out. Still, it means a small number of wallets could move the price a lot if they decide to sell or restake, no matter what either chart pattern is doing.
Social Chatter: Meme Coins on the Stable Ecosystem
Separate from STABLE's own fundamentals, there's been social media chatter, including a widely shared, translated post describing speculative meme-coin activity happening on top of the Stable chain ecosystem. 
Source: According to @Ordzworld X, Account
The post describes unrelated meme tokens gaining attention after being referenced by Tether CEO Paolo Ardoino on social media, with claims of quick market-cap gains tied to that attention.
This is unverified social speculation about separate meme assets, not information about the STABLE governance token covered in this article, and it shouldn't be read as a signal about STABLE's own price direction.
Worth being aware of as ecosystem noise, not as a data point that changes anything in the technical picture above.
4-Hour Chart: Ascending Channel, Still Technically Intact
STABLE closed the 4H candle at $0.038555, down 0.21%, after ranging between $0.038495 and $0.039179.
Price has been climbing inside a clearly marked ascending channel, two parallel, upward-sloping lines, a rising floor, and a rising ceiling, holding since the last major swing low.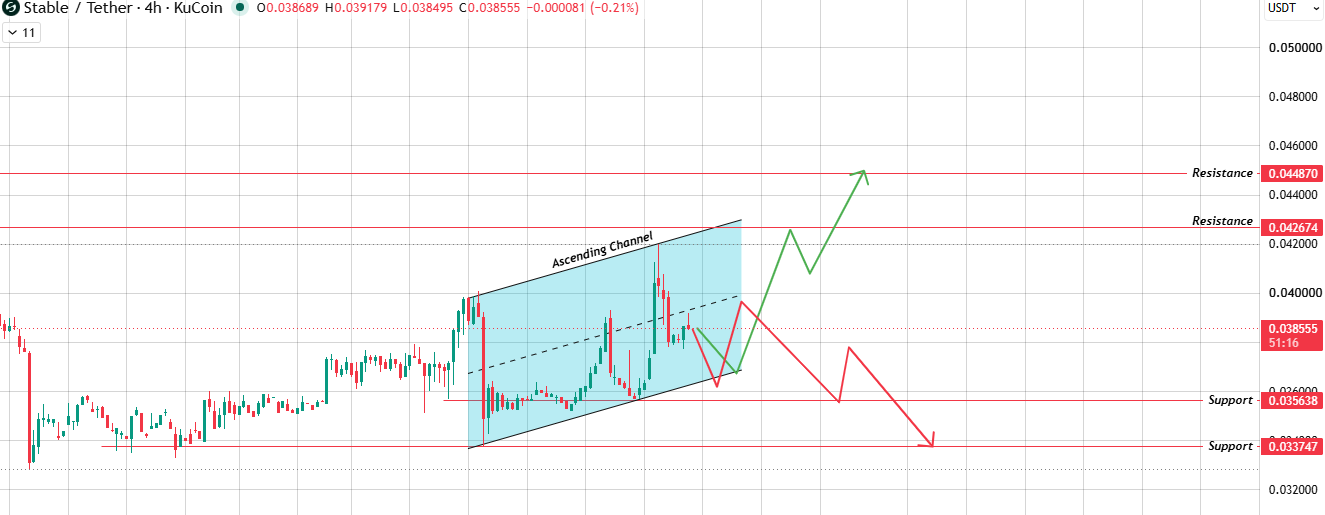
Source: Chart Taken From TradingView.
Hold that channel and clear the ceiling, and resistance sits first at $0.042674, then $0.044870 as the next resistance level.
Lose the floor instead, meaning the price actually breaks below it rather than bouncing, and support drops to $0.035638, with $0.033747 as the deeper floor underneath that.
The bullish read here gets invalidated on a clean 4H close below $0.035638. That's not just a wick poking through; it would mean the rising floor genuinely broke.
1-Day Chart: A Symmetrical Triangle With a Fibonacci Target Overhead
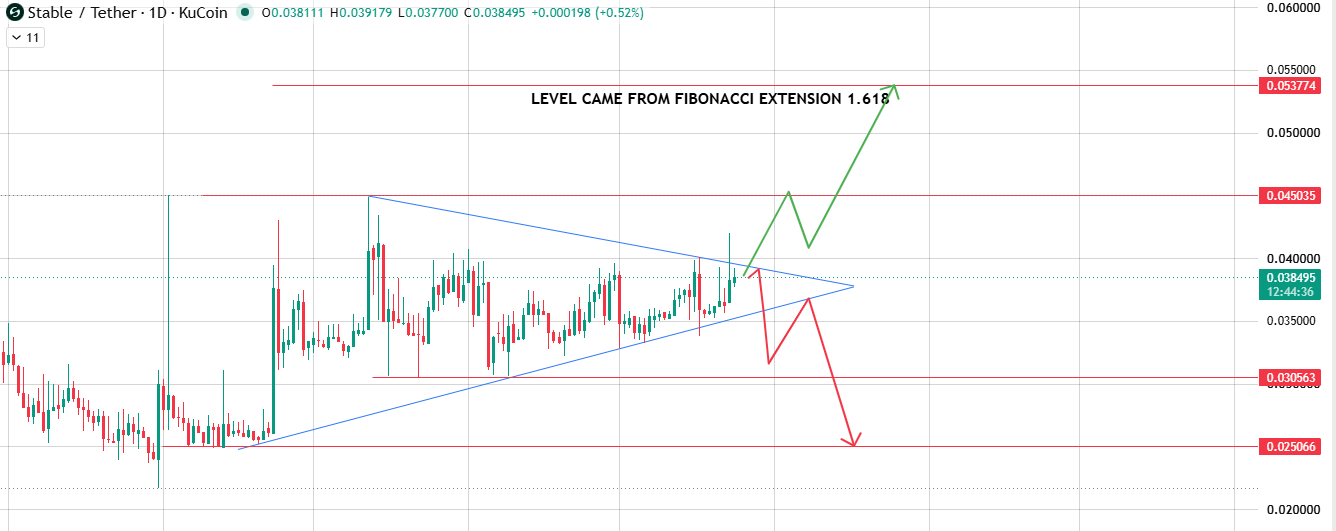
The daily candle closed at $0.038495, up 0.52%, running from a low of $0.037700 to a high of $0.039179.
What's building here is a symmetrical triangle, an upper boundary sloping down from earlier highs and a lower boundary sloping up from recent lows, both converging toward where price sits today.
Source: Chart Taken From TradingView.
A symmetrical triangle doesn't tip its hand in direction by itself; it just means the range keeps compressing until one side gives out with more force behind it.
Clear the upper boundary, and $0.045035 comes first.
Past that, the chart marks $0.053774 directly as a target derived from the Fibonacci 1.618 extension, a real, chart-drawn price target, not a round number picked out of the air. That's roughly 40% above today's price, so it's a genuine move, not a small pop.
The lower boundary breaks down instead, and support falls to $0.030563, then $0.025066 as the deeper level the chart shows.
This triangle read gets invalidated on a confirmed daily close below $0.030563 a real breakdown of the lower boundary, not just an intraday dip.
STABLE Scenario Table
| Scenario | Trigger | Target Zone |
| Bull Case | The 4H channel holds, and the +1D triangle breaks up. | $0.042674 – $0.045035 (near-term), $0.053774 (Fibonacci extension) |
| Base Case | Both structures hold, and the price consolidates. | $0.035638 – $0.039179 |
| Bear Case | Channel and triangle both fail. | $0.033747 (4H), $0.030563 – $0.025066 (1D) |
Key Takeaways
-
STABLE trades at $0.03843, down 7.3% in 24 hours, with its BTC-quoted pair down 6.5%, a close enough gap to suggest today's drop is mostly STABLE-specific, not just broad market weakness.
-
The 4H chart shows an ascending channel still technically intact; the daily chart shows a symmetrical triangle with a Fibonacci 1.618 extension target at $0.053774.
-
Token distribution is extremely concentrated; 99.80% of supply sits in the top 100 wallets, which matters more for this asset than for most, given it only launched its native token recently.
-
This bullish setup is invalidated below $0.035638 (4H) or a daily close below $0.030563 (1D); losing those levels flips the near-term bias bearish toward $0.025066.
Risk note: STABLE is a newly tokenized Layer 1 asset with a small circulating float (24.769B of a 100B total supply) and extreme holder concentration.
Both raise the odds of sharper, faster price swings than a more established, widely distributed token would show. Nothing in this article should be read as a guarantee of any outcome.
Correlation With Bitcoin
BTC dominance shows up directly in this data rather than needing to be inferred: STABLE's BTC-quoted pair moved -6.5% over 24 hours, close to but slightly less negative than its -7.3% USD move.
That gap suggests most of today's decline is coming from STABLE-specific selling rather than a broad Bitcoin-driven risk-off move, though the two are clearly still linked to some degree.
As an EVM-compatible chain built around Tether's USDT rather than Ethereum directly, STABLE's price action ties more to sentiment around Tether-affiliated projects and overall altcoin risk appetite than to ETH price movement specifically.
Final Outlook
STABLE's chart is genuinely undecided right now, and that's a fair description.
Rather than a hedge, the 4H ascending channel is intact but has room to fail, and the daily's symmetrical triangle is compressing without yet showing which side wins.
If the channel holds and the triangle breaks upward, $0.042674 through $0.045035 is the realistic near-term move, with the chart's own Fibonacci extension pointing to $0.053774 further out.
If either structure fails instead, $0.035638 and $0.033747 are the first support tests, with $0.030563 down to $0.025066 as the deeper daily-chart risk.
Given how concentrated STABLE's holder base is at this early stage, and how thin daily volume is relative to market cap, price here can move faster in either direction than the chart levels alone might suggest treat both the bull and bear scenarios as genuinely live until one of the invalidation levels above actually gets hit.
Glossary
Ascending Channel: A price structure bounded by two parallel, upward-sloping lines, a rising floor and a rising ceiling, that price moves between until one boundary breaks.
Symmetrical Triangle: A pattern formed by a downward-sloping upper boundary and an upward-sloping lower boundary converging toward each other, compressing price until it breaks in either direction.
Fibonacci Extension: A technical tool projecting a probable price target beyond a prior move, based on ratios like 1.618 that recur often in market structure.
Delegated Proof-of-Stake (DPoS): A blockchain consensus mechanism where token holders vote to elect validators, rather than validators being chosen purely by computational work or raw stake size.
Methodology
Price and technical levels, channel and triangle boundaries, support, and resistance came directly from the STABLE/USDT 1D and 4H charts on KuCoin via TradingView, reviewed July 24, 2026. Liquidation figures reflect Coinglass-style derivatives data from the same window.
Holder concentration and tier data reflect an on-chain analytics snapshot taken at the time of writing, which displays supply percentages rather than USD market-cap value.
Exchange volume figures reflect the same period across listed venues. This article does not include RSI, MACD, or moving-average data, as that was not part of the chart set reviewed for this piece; nothing here goes beyond what the source charts and data actually show.
Background on Stable and StableChain is drawn from public reporting on the project's mainnet launch and funding.
This is not financial advice. STABLE is a newly launched, thinly traded, highly concentrated token, and these levels can shift quickly.
Disclaimer: This article is for informational purposes only and is not financial advice. Cryptocurrency markets are volatile; do your own research before investing.
0
0


 Manage all your crypto, NFT and DeFi from one place
Securely connect the portfolio you’re using to start.

0
0

0
0

0
0

0
0