Cardano slumps below $0.24 as on-chain signals flash sell-off risk

0
0

The crypto market has been bullish over the past few days but Cardano remains one of the most bearish coins in the top 20.
The coin lost its place in the top 10 earlier this month and has been underperforming since then.
Cardano (ADA) is trading below $0.240 on Wednesday, down by more than 2% in the last 24 hours.
On-chain metrics point to a bearish outlook, as a surge in dormant wallet activity and a negative spike in the Network Realized Profit/Loss (NPL) indicator suggest early investors may be offloading tokens, increasing the likelihood of a deeper correction in the near term.
ADA stays below $0.2400: On-chain data shows selling pressure
Data obtained from Santiment suggests selling pressure for Cardano.
Santiment's Network Realized Profit/Loss (NPL) indicator calculates a daily network-level Return On Investment (ROI) based on the coin's on-chain transaction volume, which measures market pain.
A surge in a coin’s NPL suggests that the holders are selling their bags at a significant profit.
However, strong dips imply that the coin's holders are, on average, realizing losses, suggesting panic sell-offs and investor capitulation.
The NPL for Cardano showed a massive dip on Tuesday, indicating that holders, on average, were realizing losses.
Furthermore, Santiment’s Age Consumed index also showed an upward spike, suggesting dormant ADA tokens are now being moved (most likely to exchanges).
Usually, a surge in dormant wallet activity combined with a negative dip in the NPL indicator leads to massive sell-offs in Cardano.
The derivatives data also suggest that the bears are currently in control. CoinGlass' long-to-short ratio for ADA reads 0.95 on Wednesday.
This metric has been mostly negative over the past four weeks.
A ratio below one indicates bearish sentiment in the market, as traders are betting that the asset price will fall.
Cardano price forecast
The ADA/USD 4-hour chart is extremely bearish as Cardano is down 8% in the last seven days.
ADA is currently trading at $0.239, holding well below the 50-day, 100-day, and 200-day Exponential Moving Averages (EMAs).
The $0.2450 resistance level continues to cap further upward movement, with the 50-day EMA at $0.262 and the 23.6% Fibonacci retracement of the latest downswing at $0.271 layering additional overhead supply.
A subdued Relative Strength Index (RSI) on the 4-hour chart is around 43, and a slightly negative Moving Average Convergence Divergence (MACD) reading suggests that upside momentum is weak.
This implies that rallies are likely to face selling pressure at these resistance levels.
If the bulls regain control and the daily candle closes above the $0.2450 resistance level, it would allow ADA to extend its rally towards the 50-day EMA at $0.262 and the 23.6% retracements at $0.271.
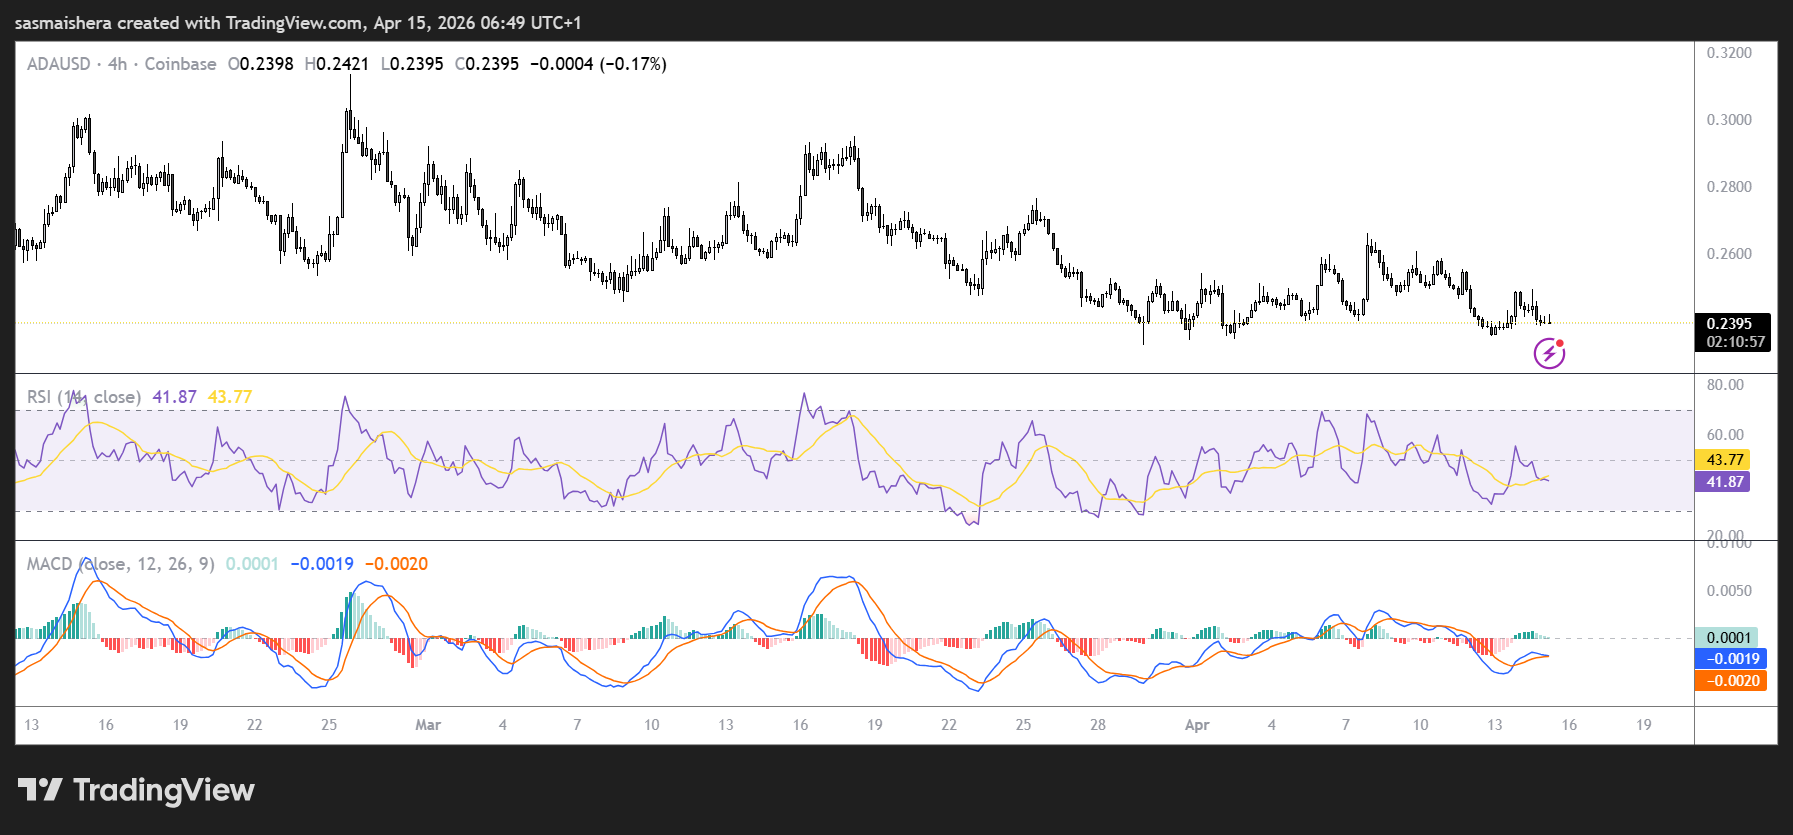
Further resistance levels lie around $0.299 and the $0.303 area, where the 38.2% Fibonacci retracements clusters with the 100-day EMA.
The 200-day EMA at $0.4000 is less likely to play out in the near term as the market conditions remain fragile.
However, if the bears remain in control, they would encounter immediate support at the $0.2200 level, where buyers would be expected to defend the latest cycle low if the decline extends.
The post Cardano slumps below $0.24 as on-chain signals flash sell-off risk appeared first on Invezz
0
0

 Manage all your crypto, NFT and DeFi from one place
Securely connect the portfolio you’re using to start.


0
0

0
0