
Arbitrum Price Prediction August 2026: Will $ARB Bounce Back?

0
0

$Arbitrum has been going nowhere fast for most of this month, and honestly, that's kind of the point of this Arbitrum price prediction August 2026.
$ARB sits at $0.07904 right now, up 1.6% today, and while that number on its own doesn't say much, both the daily and weekly charts happen to be sitting at their own decision points at exactly the same time.
That's the part worth paying attention to.
$Arbitrum Price Today: Live Data and 24-Hour Change
$ARB is currently trading at $0.07904 as of writing, up 1.6% over the past day, after moving through a fairly tight range between $0.07712 and $0.08001.
Market cap comes in at $522.981M, with outstanding token value at $511.563M and a fully diluted valuation of $790.711M. 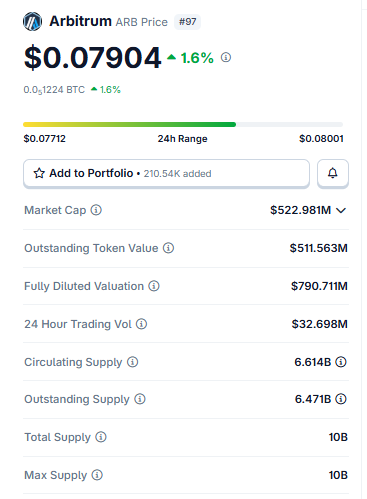
Source: $ARB Market Cap Data Taken From Coingecko, data as of July 30, 2026. Figures may vary slightly across other tracking websites.
There's a real gap between market cap and FDV there, which basically means more ARB is still due to enter circulation down the road. Volume over the last 24 hours was $32.698M.
The circulating supply currently sits at 6.614B ARB, the outstanding supply is 6.471B, and both the total and max supply are fixed at 10B ARB.
So most of ARB's eventual supply is already out and trading, which is honestly a decent setup compared to coins that still have most of their supply locked up somewhere.
Technical Analysis: Key Support and Resistance Levels (Arbitrum)
$Arbitrum Daily Chart: Ascending Channel
The daily chart shows $ARB slowly climbing inside an ascending channel for a few weeks now.
The most recent candle opened at 0.0792, poked up to a high of 0.0802, dipped to 0.0787, and closed flat at 0.0791, barely any movement, just testing the top of the channel. 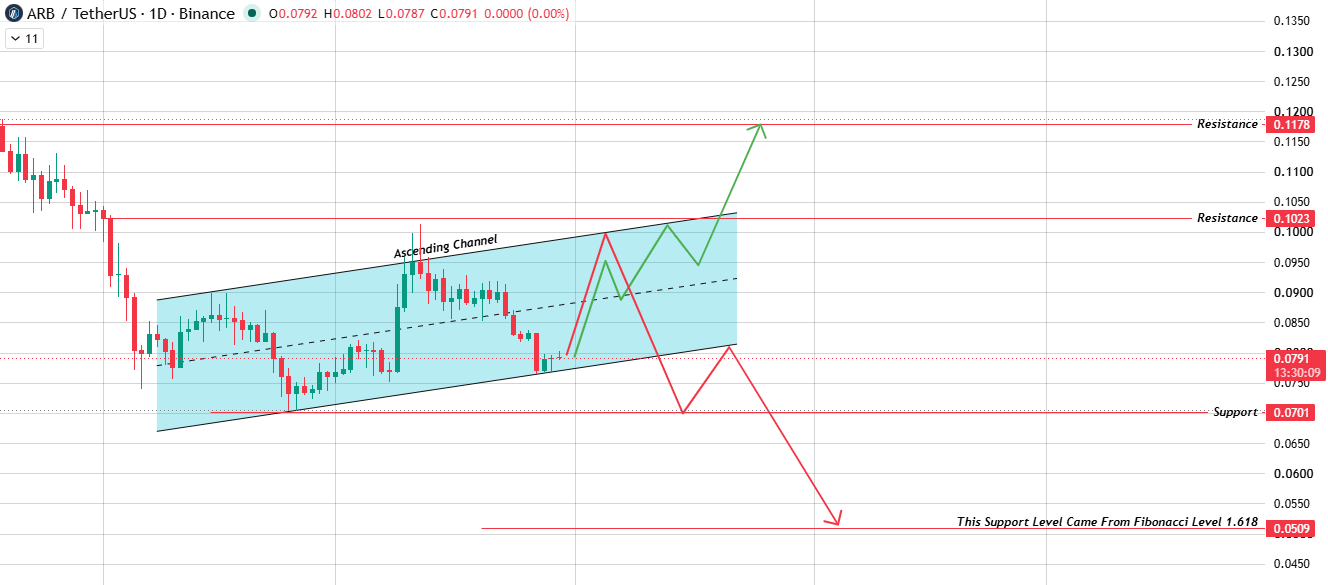
Source: Chart Taken From TradingView.
Get real volume behind a push through that upper boundary, and $0.1023 becomes the first level to watch, with $0.1178 next if buyers keep coming.
If $ARB can't actually break through, though, the more realistic path is a pullback down to $0.0701, and if that doesn't hold either, the 1.618 Fibonacci level near $0.0509 is the next stop down.
$Arbitrum Weekly Chart: Falling Wedge at the Apex
Zoom out and the weekly chart tells a different story. $ARB has been sliding inside a falling wedge for a while, and the price has now worked its way all the way to the tip of it, which is basically a coin flip moment. 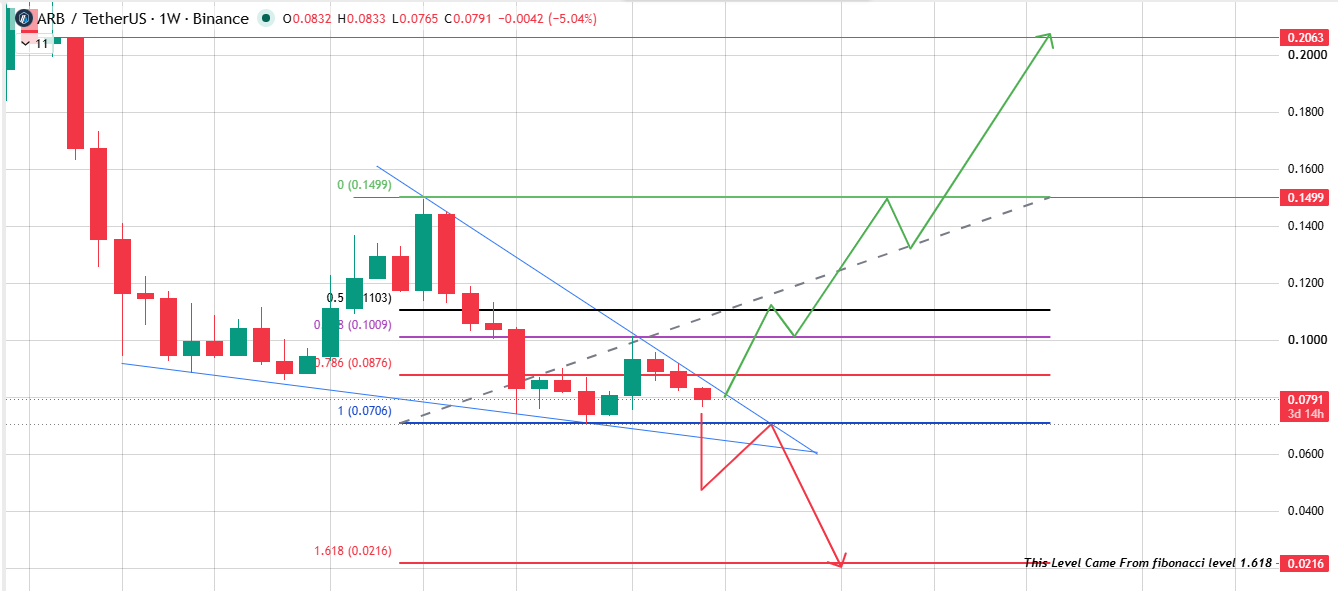
Source: Chart Taken From TradingView.
Last week's candle opened at 0.0832, ran up to 0.0833, dropped hard to 0.0765, and closed at 0.0791, down just over 5% for the week.
If volume shows up and ARB actually breaks upward out of this wedge, $0.1499 is the first real target, and things could stretch as far as $0.2063 if the move has legs.
Break down out of the wedge instead, and there's a lot more room to fall, with the chart's own Fibonacci extension pointing toward $0.0216 in that scenario.
Arbitrum Price Prediction for August 2026: Bull, Base, and Bear Cases
Here's the thing about this arbitrum price prediction August 2026: it really just comes down to whether two separate charts agree with each other or not.
The daily chart has $ARB inside a rising channel, banging against resistance. The weekly chart has it stuck in a falling wedge, sitting right at the very tip.
For the bullish version to actually happen, ARB needs real buying volume to push through daily resistance while that weekly wedge breaks upward at the same time.
Pull that off, and $0.1023 is the first stop, then $0.1178, with the weekly chart's much bigger targets near $0.1499 and $0.2063 opening up if things really get going. The base case is nothing dramatic.
$ARB just keeps bouncing around between support and resistance without really committing either way.
On-Chain and Fundamental Drivers (Arbitrum)
The supply picture is probably the biggest thing shaping any serious ARB valuation right now.
With 6.614B ARB already out of a fixed 10B max supply, most of the token is already circulating, which cuts down on the kind of unlock pressure that drags on a lot of other altcoins.
That said, there's still some supply left to enter the market, so a bit of dilution risk sticks around for anyone thinking long-term about the Arbitrum price target in 2026.
August 2026 Catalysts That Could Move Arbitrum
Keep an eye on Arbitrum's Layer 2 ecosystem growth, developer activity, and any protocol updates this month, since those are the ARB-specific things that matter most.
Outside of that, whether ARB actually clears daily resistance or breaks its weekly wedge will probably shape sentiment more than anything else, alongside whatever mood the broader crypto market is in.
What Analysts Are Forecasting (Arbitrum)
So, will Arbitrum go up in August 2026? That mostly hinges on whether buyers can push through daily resistance at the same time the weekly wedge resolves upward.
If both line up, that's a genuinely strong signal.
If either one gets rejected, $ARB probably just stays stuck in its recent range a bit longer.
None of this is a promise of what happens next, just what the charts are showing right now.
Arbitrum Long-Term Outlook: 2027 to 2030
Clear both the daily and weekly resistance zones this year, and a longer climb toward $0.1499, maybe even $0.2063, looks like a fair target stretched across 2027 and 2028.
What Arbitrum will actually be worth in 2030 comes down a lot more to real Layer 2 adoption than to any chart pattern, but the current setup at least gives a reasonable place to start.
Risks That Could Invalidate This Forecast (Arbitrum)
The main risk here is $ARB failing at daily resistance and breaking down through the ascending channel instead.
That opens up the support level to watch at $0.0701, with $0.0509 next, and the weekly wedge breakdown pointing all the way toward $0.0216 in a genuinely bad case.
Is Arbitrum oversold right now? Maybe, at these levels, but oversold conditions can absolutely get more oversold if the broader market turns sour.
How to Buy and Store Arbitrum Safely
ARB is available on most major exchanges, usually paired against USDT or USD.
Since most of its supply is already circulating, short-term price action is driven more by chart behavior and demand than by any looming unlock event.
Hardware wallets make sense for bigger, longer-term holdings, while exchange wallets are fine for smaller amounts you're trading more actively.
Disclaimer: This arbitrum price prediction is for informational and educational purposes only and should not be considered financial or investment advice. Cryptocurrency markets are highly volatile, and prices can change rapidly. Always conduct your own research and consult a qualified financial advisor before making any investment decisions.
0
0


 Manage all your crypto, NFT and DeFi from one place
Securely connect the portfolio you’re using to start.

0
0

0
0

0
0

0
0