Polkadot price analysis: DOT price drops to $6.15 as market conditions turn bearish
0
0

Polkadot price analysis shows a bearish outlook for cryptocurrency today after the DOT/USD pair dropped to $6.15 after hitting a high of $6.48 the previous day. The market sentiment is bearish as the price has broken out from the ascending triangle pattern, which had been in play for several days. The selling pressure has further pushed the price below $6.48, which is now the resistance level. The support for DOT/USD is seen at $6.04, with further potential downside to $5.90 and beyond.
The market capitalization of Polkadot is currently hovering around the $7.18 billion mark, with a loss of 4.91% over the last 24 hours. The total trading volume for the cryptocurrency is now at $201 million, with a decrease of 12.77% over the same period.
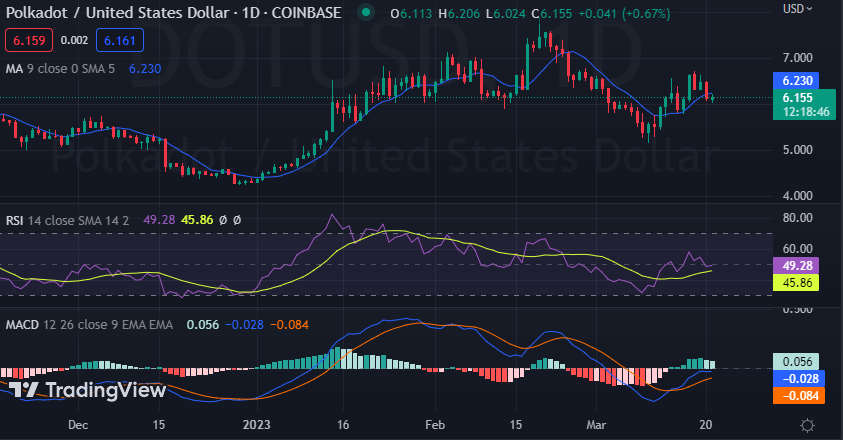
Polkadot price analysis 1-day chart: Recent setback turns DOT down to the $6.15 mark
The 24-hour chart of Polkadot shows a bearish sentiment in the market as the price drops to $6.15 after breaking out from the ascending triangle pattern. The 4.91 percent decrease in the price is a result of the selling pressure that has been seen over the past few hours. The market has formed lower highs in the form of a symmetrical triangle, which is an indication that the bears currently have control of the market.
The Relative Strength Index (RSI) on the daily chart is in the neutral zone and has not been able to breach the oversold level. RSI is currently at 49.28 and suggests that the market is still bearish, with more downward pressure expected in the near future.

The moving average converges and diverges (MACD) has also entered the bearish zone, with red bars appearing on the histogram. This indicates a further slide in prices as the bears are taking control of the market. The moving average indicator value is at $6.23, which shows that the bears have a strong presence in the market and are likely to push prices lower.
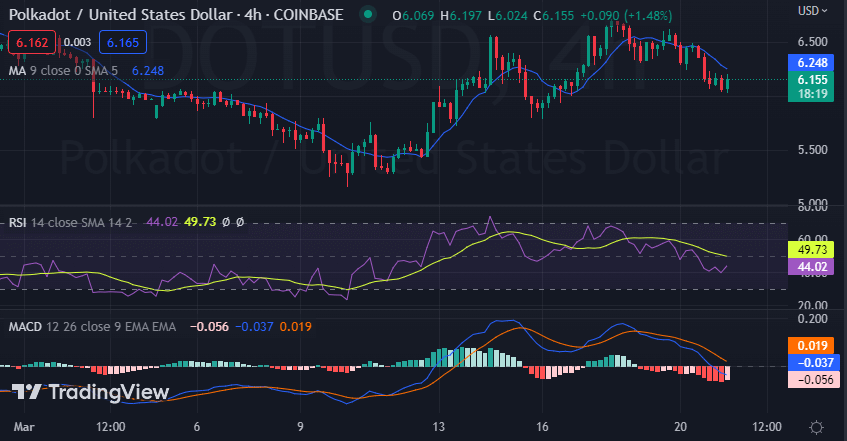
Polkadot price analysis 4-hour chart: Bears take control as DOT breaks out from the ascending triangle
The 4-hour chart for Polkadot price analysis shows that the coin is still in the bearish territory as the price has failed to break above $6.48, which is now acting as resistance. The red candlesticks are dominating the chart as bears take control of the market, pushing prices lower. Being no bullish momentum for the coin, the price is likely to move even lower unless there is a major shift in market sentiment.

The Relative Strength Index (RSI) on the 4-hour chart is currently at 44.02 and has entered the neutral zone, indicating that further selling pressure may soon appear in the market. The MACD on the 4-hour chart is in the bearish zone, with red bars appearing on the histogram. The signal line(red) is below the MACD line (blue), which suggests that selling pressure is likely to continue. The 50-day and 200-day moving averages have crossed each other, which is another bearish signal for the coin.
Polkadot price analysis conclusion
In conclusion, Polkadot price analysis is bearish today as the previous bullish momentum has been reversed by strong selling pressure. The current support level for DOT/USD is seen at $6.04, and if bearish persists, the price could drop further to $5.90 and beyond, and a break above $6.48 could result in a bullish move.
0
0
 Manage all your crypto, NFT and DeFi from one place
Securely connect the portfolio you’re using to start.


