POGAI Token Hits $0.0000879 After a Successive Bullish Run
1y ago•

bullish:
1
bearish:
0
Share

- POGAI token has shown overall growth in price, volume, and market cap in the last 24 hours.
- The token has formed a double bottom pattern on the daily chart, indicating a possible trend reversal.
- The POGAI token has seen a massive spike in price during the last 24 hours, rising from its previous $0.0000386 low to a high of $0.0001346.
The POGAI network has emerged among the top trending altcoins, following an overall growth in price, volume, and market cap. The token recorded a whopping 108% spike in its price during this time frame. Analysts predict that the bullish momentum is likely to continue, with further gains expected soon.
The Pogai token is trading at $0.00008911, with a 24-hour trading volume of $30,939,808. Pogai cryptocurrency is facing resistance near the 12-day EMA of $ 0.0001346.

The Fibonacci extension levels indicate the token bounced off the 0.618 Fib level at $0.0000879. And is further expected to surge above the 1.618 Fib level at $0.0001111.
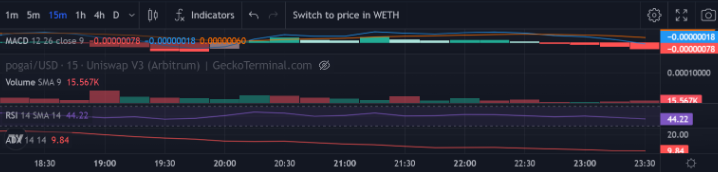
Pogai’s technical analysis reveals the price is currently hovering above the 50-day EMA. And also the MACD indicator shows a bullish crossover. The bulls have successfully breached weekly resistance at $0.0000818, indicating a further uptrend in the near term.
Pogai’s technical analysis on the daily timeframe indicates the altcoin peaked near the $0.0001346 resistance level and is currently facing a slight pullback. However, the double bottom pattern formed on the daily chart could signal a possible trend reversal in the coming days.
When a double bottom pattern forms, it always suggests an upcoming bullish reversal, and that is precisely what the POGAI chart indicates. The altcoin has successfully broken above its previous resistance level. However, further buying action is needed for the token to reach a new all-time high. On the upside, the digital asset could reach $0.0001839 if a rally is initiated in the next few days.
POGAI Token Trades in a Symmetrical Triangle Pattern
On the 4-hour chart, the altcoin is trading inside a symmetrical triangle pattern, which suggests the price is consolidating and a breakout is imminent in either direction. If the buyers can push the token past the $0.0001346 resistance, we could see POGAI reach its next major target of $0.0001839 with ease.
Most of the popular technical indicators, such as the Average Directional Movement Index and the Relative Strength Index are reporting buying sentiment in the market, as both indicators have recently crossed into bullish territory. The Ichimoku Cloud indicator also suggests there is an upcoming bullish reversal in the near term.
It remains to see if the POGAI token will break above its major resistance and enter a new bull rally. The altcoin has shown immense growth potential throughout the past few weeks, with prices fluctuating around their current levels.
With all the buying sentiment in play, it is possible that the token reaches its next major target and enters a new bullish cycle soon. The altcoin has been trading within a wide range over the past few days. Moreover, a strong rally expected to push POGAI to its next all-time high soon.
To sum up our Pogai price analysis, a consolidation phase might be imminent before a strong uptrend follows. With all indicators suggesting a bullish continuation, fundamental development, and market sentiment will be the major driving forces for the altcoin in the next 24 hours.
1y ago•
bullish:
1
bearish:
0
Share
 Manage all your crypto, NFT and DeFi from one place
Securely connect the portfolio you’re using to start.

bullish:
0
bearish:
0


bullish:
0
bearish:
0

bullish:
0
bearish:
0