

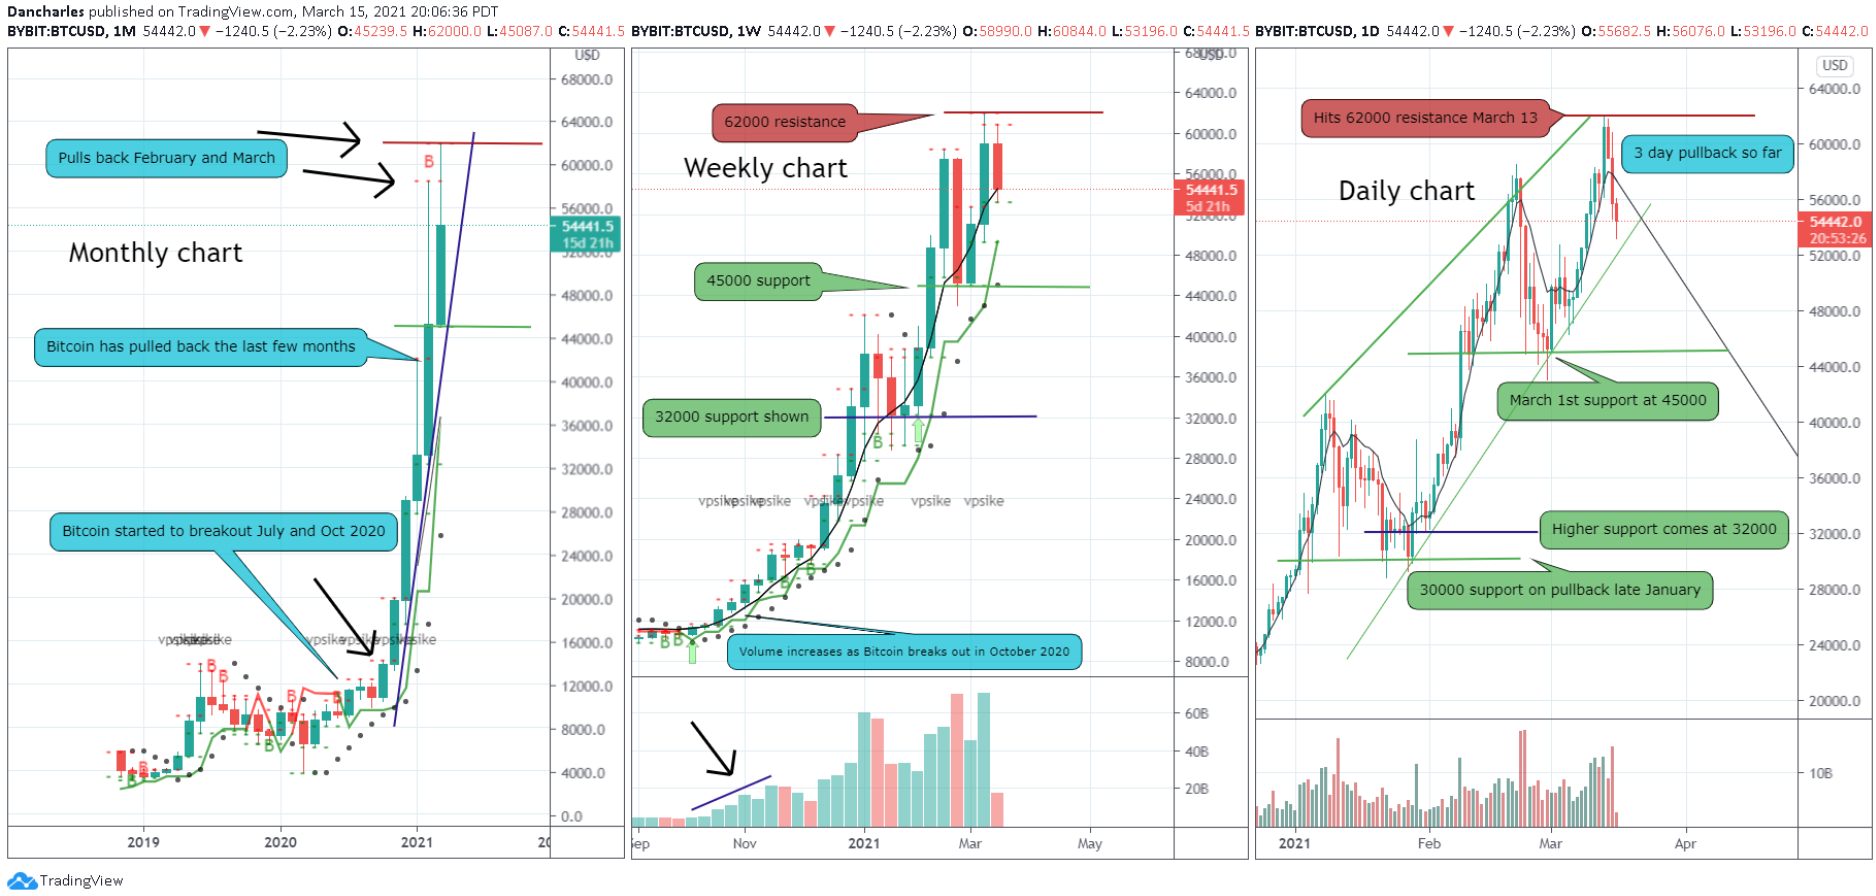
Looking at the daily, weekly and monthly chart of Bitcoin, my first observation is the resistance price of $62.000 was hit on March 13th. The price of Bitcoin has been on a massive bull run really since October 2020.
From left to right, the monthly chart shows the initial breakouts in July and October 2020 and the huge run ups in the months to follow. On the positive we can see that each of the previous two months there were large pullbacks but ultimately the bull run continued which gives this pullback hope.
The middle weekly chart we see the 62000 resistance hit, along with various levels of support at $45.000 and $32.000. We also point out the volume picking up with the rally in October.
On the far right daily chart we are pulling back the last 3 days, which if you look at the last couple of pullbacks they were certainly longer than 3 days. Another very important point is that this recent run up rally from the March 1st is smaller rally from the 32000 support breakout which shows some weakening.
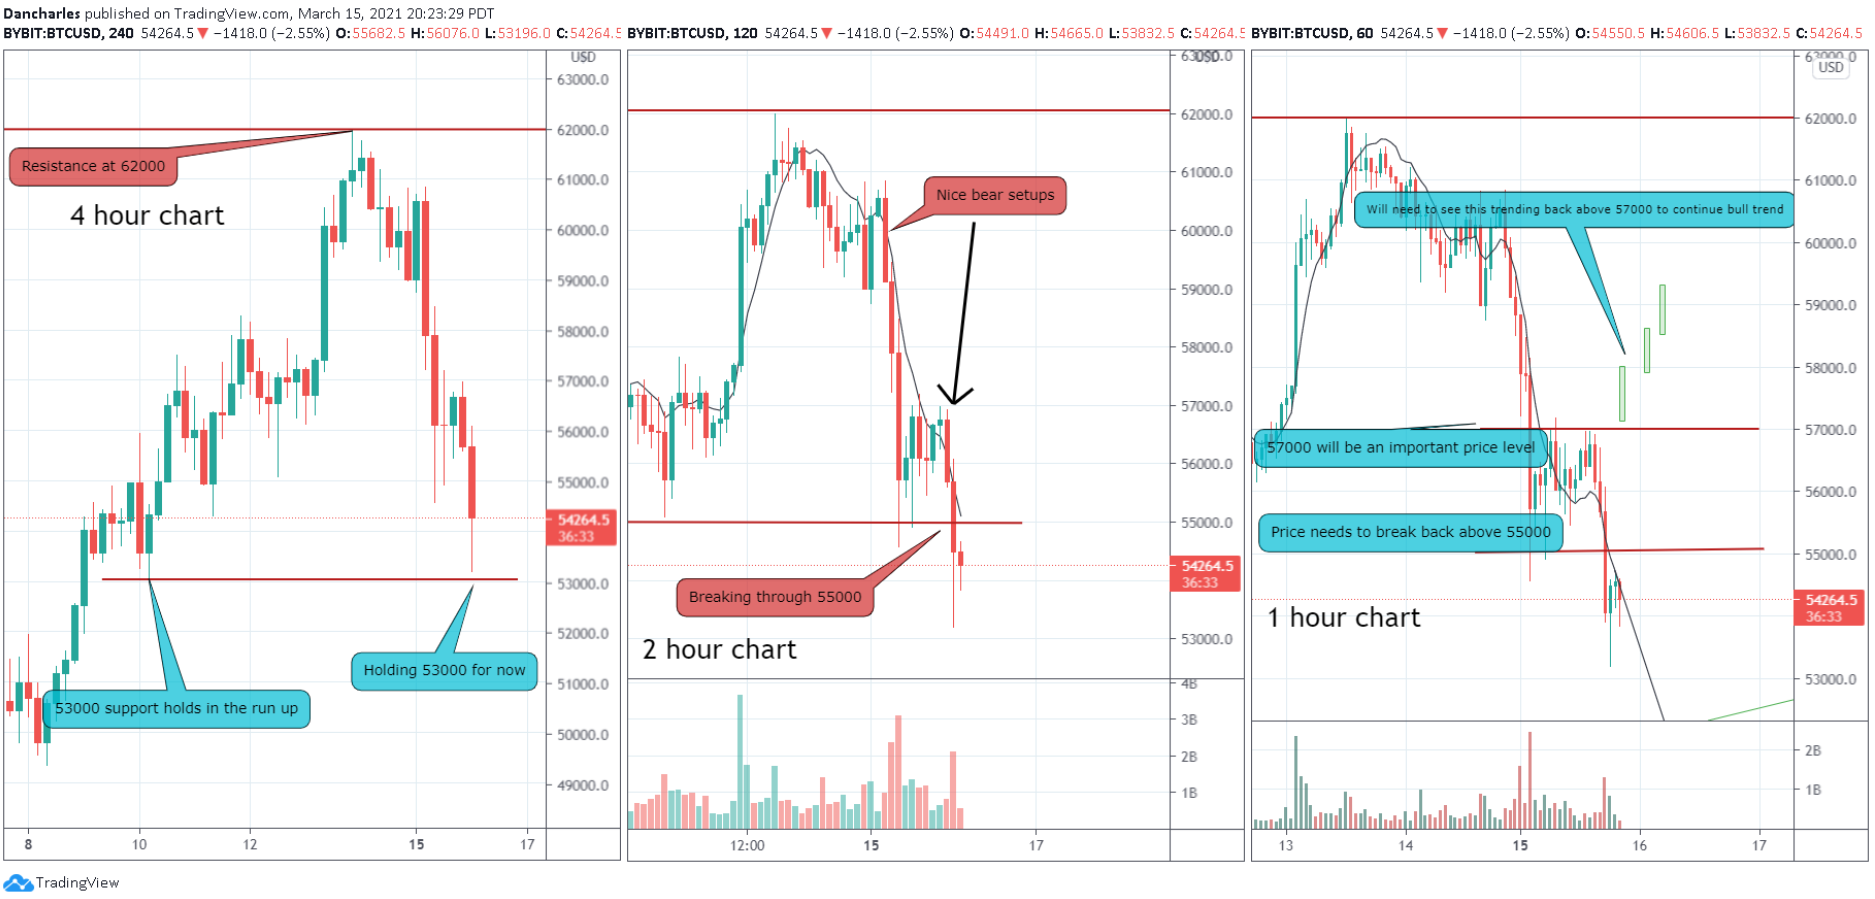
On short time frames, we go to the left 4 hour chart which points to the recent support at 53000 hit. This really needs to hold that support and start a turn around rally if you are a bitcoin bull.
The middle 2 hour chart shows the very nice bearish setups and the breakdown through 55000 support. The current candle is so far putting in a higher low from theprevious candle which hit the $53.000 support.
On the right 1 hour chart, it is outlined pretty simply that I would need to see the two resistance levels of $55.000 and $57.000 break before I would be confident of the rally continuing.
To sum up, the price of Bitcoin is in a pullback right now and if we are going by the past then we should see lower price levels. The key support levels of $53.000 need to hold up and in my analysis I would need to see a breakout above $57.000 to give me confidence the rally continues.
We can’t overlook when an exact resistance price ($62.000) is hit. The last couple months show that Bitcoin does tend to pullback and continue the rally. All this information makes me split and waiting for things to playout first in the coming days.


