Here’s what can trigger a MATIC rally
2
1

MATIC's price movement over the last two months has been nothing short of a nightmare. The alt rallied by almost 500% in just one month, touching an all-time high of $2.57. However, glory is often short-lived and MATIC’s glory days soon came to an end as the coin saw sustained losses after losses followed by sideways movement and well, more losses. Amid its many market crashes, however, as most people lost hope of recovery, MATIC stood back and rallied by almost 40%, leaving most in the market surprised.
Since June, the crypto has been undergoing mini price dips. Its more worrisome southbound movement began only in mid-July though, when the alt tested the $0.92 support and stayed under that for a good one week. The altcoin, after testing lower levels of $0.685, bounced up and rallied by more than 41% at press time.
In fact, MATIC was trading $0.931 with weekly gains of 8.08%, a figure that was higher than the same for most top alts barring Ethereum.
Source: MATIC/USDT Trading View
Further, MATIC’s volume profile finally revealed accumulation, with daily volume coming in at 3 times the daily average. Additionally, the alt’s real volume stood at $1.32 billion on 21 July, its highest figures since 22 June. Most notably, the recent trade volumes were the highest green peaks after the June price gains.
The alt’s Relative Strength Index, at its peak, was clearly in the overbought zone, with the indicator usually on a steady downtrend since. In fact, even immediately after the price peaks in May, the RSI failed to break past that linear downtrend. This time, however, the rally has been bigger than the ones in the past, with the RSI finally breaking past this trend on the 12-hour chart.
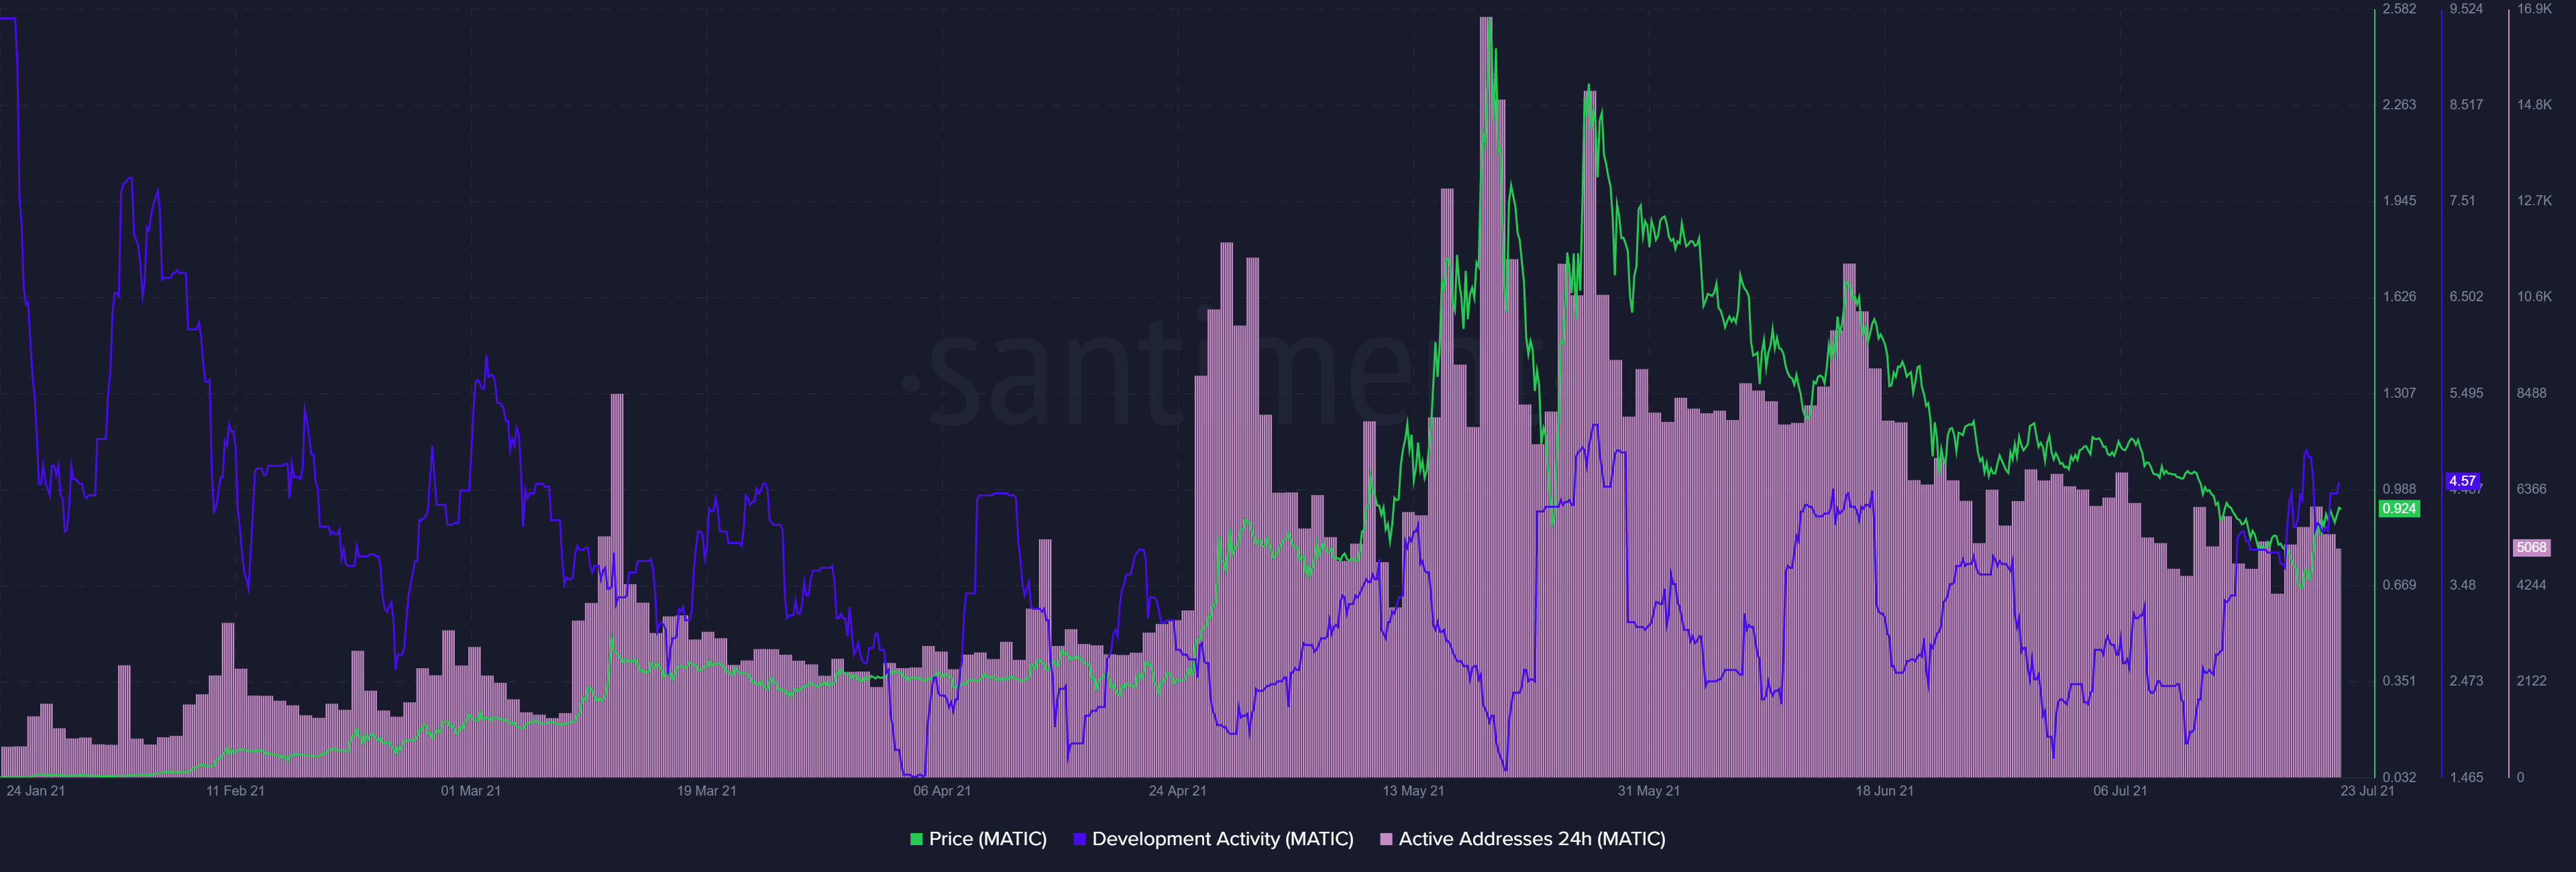
That being said, it’s also important to note what metrics say about MATIC’s recent price gains. One metric that stands out most is development activity since it saw a massive uptick in the last 24 hours. In fact, it touched its May-end levels too. In hindsight, it's also notable that Polygon has been integrating its network with features like Ante Finance and Polycash.
Source: Sanbase
Now, even though there was a major surge in dev activity, active addresses remain underwhelming and are still below May-June levels. On the other hand, exchange inflows for MATIC saw a major uptick on 22 July almost equivalent to its May-end levels. Generally, an increase in inflows to exchanges indicates dumping from individual wallets, a finding highlighting selling pressure. Alas, that didn’t seem to be the case as per the RSI.
What’s more, an interesting uptick in MATIC’s velocity was the highest level seen this year - A sign that the coins were circulating within the network more rapidly than ever.
Source: Sanbase
With most metrics painting a pretty picture for MATIC, it can surely be said that the alt has been in a good shape of late. However, to register sustained price gains, the alt needs to break the $0.926 resistance and convert that to support. Nevertheless, it’ll be good to keep in mind that the crypto is only up 8% for the week and is still down 23% in July.
The post Here’s what can trigger a MATIC rally appeared first on AMBCrypto.
2
1


 Manage all your crypto, NFT and DeFi from one place
Securely connect the portfolio you’re using to start.


