Litecoin price analysis: Bulls maintain uptrend at $92.30 as buyers remain in control
0
0

The most recent Litecoin price analysis shows an uptrend in the market. The bulls maintain the uptrend at $92.30 as buyers remain in control of the digital asset. LTC/USD has seen a strong positive momentum since breaking above the $90 resistance level, with prices currently trading around $92.30.
The bulls are presently targeting the next resistance at $93.97, where a break above it could open the door for further buying, potentially pushing prices toward $100. On the downside, there is strong support at $89.87 and buyers are likely to come in if prices dip below this level.
The market capitalization of Litecoin is currently at $6.69 billion, with the 24-hour trading volume standing at $549 million. The current market sentiment for LTC/USD remains bullish and buyers are likely to remain in control for the short term, with further gains expected over the coming days.
Litecoin price analysis 1-day price chart: Bullish pushes LTC above the $92.00 level
The one-day Litecoin price analysis confirms a strong bullish trend for today as the coin value has undergone a considerable improvement. Though the coin value suffered previously due to the bearish pressure, however, the bulls have now managed to push the coin past the $92.00 mark with positive momentum. At present, Litecoin is trading at $92.30, still in the green zone and showing signs of further bullish action.
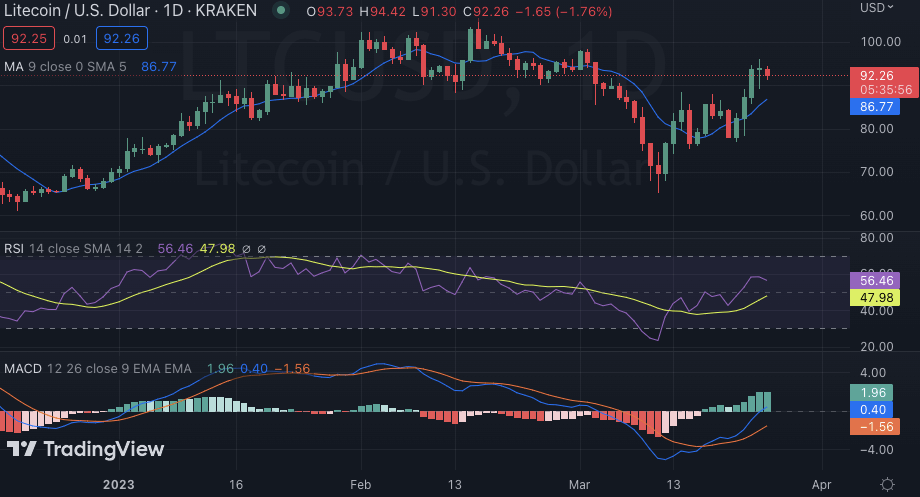
The MACD shows that there is strong buying pressure in the market which could propel prices higher if maintained. The Relative Strength Index (RSI) is currently at 56.46, indicating that the market is bullish but could be overbought if buyers continue to push prices higher. The 50-day Moving Average (MA) also remains above the 200-day MA, signifying that the long-term trend for Litecoin is still positive.
Litecoin price analysis: Bulls pattern suggests further price gains
The 4-hour Litecoin price chart shows that the bulls have maintained control of the market and are pushing prices higher. The most recent pattern seen on the chart is a flag formation, which generally indicates a continuation of the previous trend. The buying pressure has been strong and could be the catalyst for further price gains in the near term.
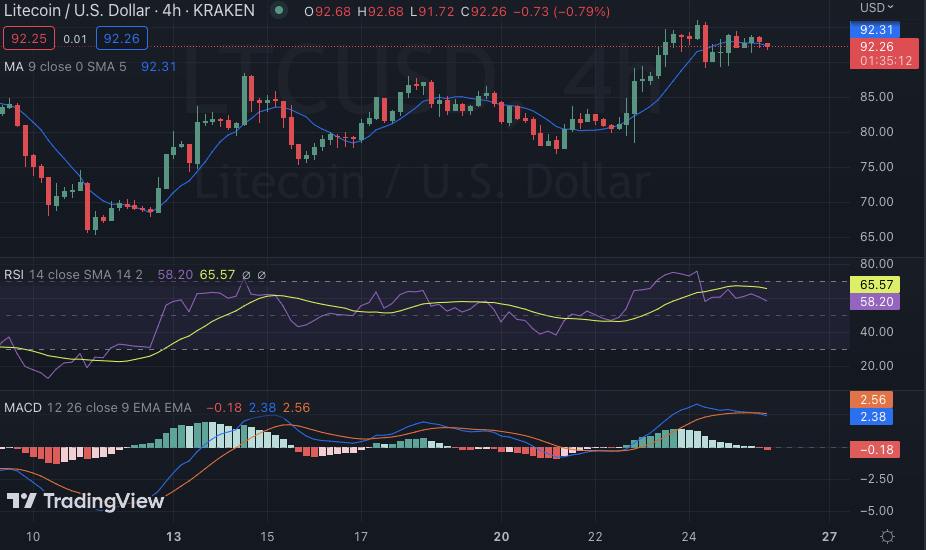
The four-hour technical indicators are also in favor of the bulls. The Moving Average Convergence Divergence (MACD) line has crossed above the signal line, indicating an increase in buying pressure. The Relative Strength Index (RSI) is also near the overbought zone, indicating that buyers are in control of the market and could push prices higher in the short term. The moving average indicator (MA) also continues to remain above the 200-day MA, indicating that the long-term trend is still bullish.
Litecoin price analysis conclusion
Overall, Litecoin price analysis suggests that the uptrend will continue in the short term and buyers could push prices higher toward $93.97 if they maintain their buying pressure. The support level at $89.87 should be monitored closely as this could be a major indicator of the trend for Litecoin in the near term. If buyers manage to maintain their buying pressure, then prices should surge higher toward $100.
0
0


 Manage all your crypto, NFT and DeFi from one place
Securely connect the portfolio you’re using to start.

0
0


0
0