Idle Ethereum Tokens Move in Highest Volumes Since November 2021 — Will ETH Price Crash?
7M ago•

bullish:
0
bearish:
0
Share
Key Takeaways:
- Dormant Ethereum tokens have started moving again.
- These tokens have not made it to the exchanges so far.
- Either way, such movements have preceded price crashes in the past.

YEREVAN (CoinChapter.com) — Ethereum (ETH) tokens that were sitting ducks for years started moving en masse in September 2023, raising the possibility of a price crash.
Big Ethereum Investors Move Tokens
Notably, the “Age Consumed” metric at Santiment, which represents “the number of tokens changing addresses on a certain date, multiplied by the time since they last moved,” spiked recently. However, it did not entail the core reason behind the movement.
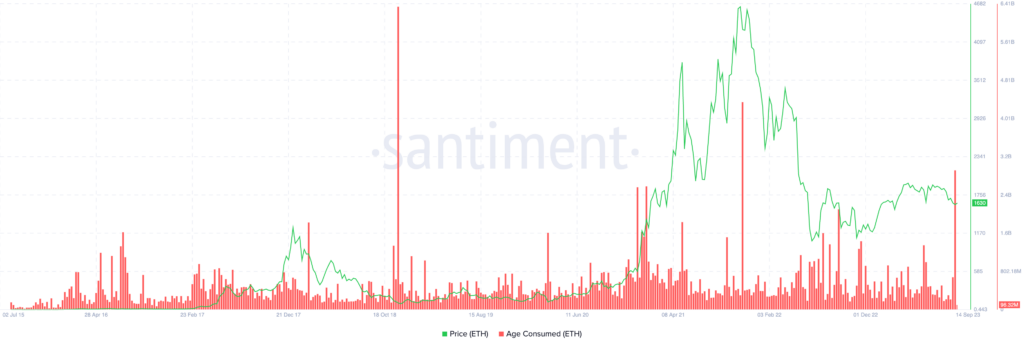
For instance, big Ethereum investors may have moved the ETH tokens to exchanges to sell them, as what transpired after the November 2021 Age Consumed hike. Or, they may have redistributed a portion of their Ethereum holdings to new crypto addresses, a common practice to minimize HODLING risks.
Therefore, it is wiser to combine the Age Consumed metric with other on-chain indicators to determine a clearer market bias.
No Big Movements to Crypto Exchanges
Older Ethereum investors have moved tokens but have not transferred them to crypto exchanges.
For instance, the Age Consumed metric spiked in the period that saw the Ethereum balance across exchanges stabilizing at around 14.55 million ETH. That is unlike in November 2018, when the exchanges’ ETH balance surged from 18.23 million ETH to 23.25 million ETH — and the ETH price crashed — during the big coins movement.
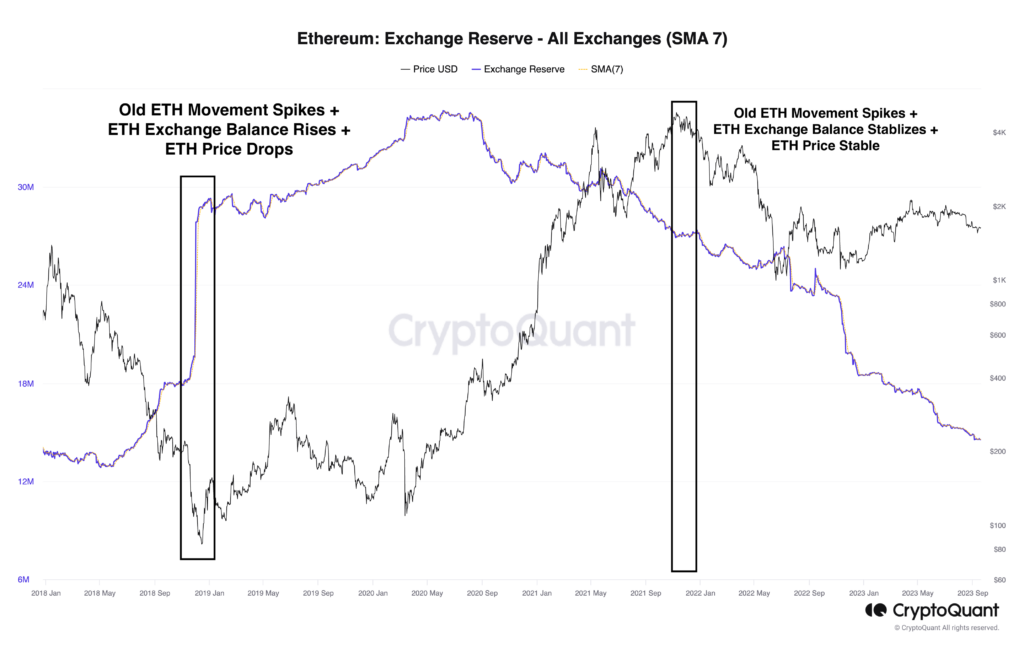
However, the ETH price bottomed out in December 2018, suggesting that big coins’ decision to move Ethereum tokens did not transform into a broader bearish trend. Conversely, the November 2021 Ethereum movement coincided with stable ETH exchange reserves and prices but preceded a bear cycle.
Therefore, big coins may have conducted their sales via over-the-counter (OTC) desks.
What Happens to Ethereum Price Now?
Ethereum eyes a short-term recovery toward $1,990 in 2023 as it fluctuates inside an ascending triangle pattern. But looking broadly, the triangle is part of a prevailing downtrend, which, per the technical analysis rule, raises bearish continuation risks.
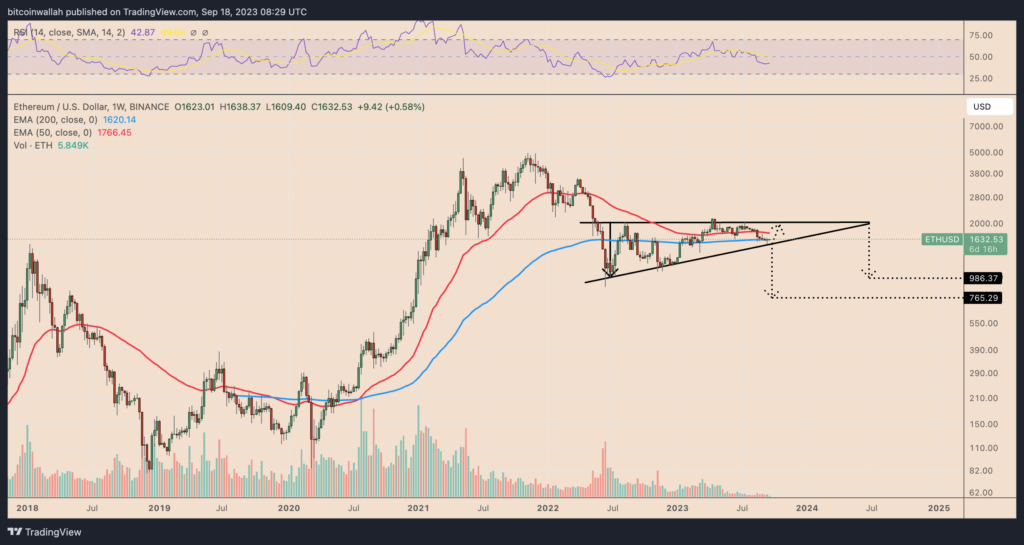
Notably, a decisive break below the triangle’s lower trendline raises the ETH price’s risks of declining by as much as the pattern’s maximum height. So, depending on the breakdown point, the ETH price could drop between $765 and $990 by Q1/2024.
The post Idle Ethereum Tokens Move in Highest Volumes Since November 2021 — Will ETH Price Crash? appeared first on CoinChapter.
7M ago•
bullish:
0
bearish:
0
Share


 Manage all your crypto, NFT and DeFi from one place
Securely connect the portfolio you’re using to start.

bullish:
0
bearish:
0

bullish:
0
bearish:
0

bullish:
0
bearish:
0

bullish:
1
bearish:
0