Binance Coin price analysis: BNB/USD bearish as prices slip to $1.00
0
0

Binance coin price analysis shows a downward trend today as the market price decreases to $1.00 after a bearish run. The upper boundary of the range is at $1.00, while the lower boundary is at $0.9995 after undergoing a 24-hour loss of 0.02%. A breakout from this range will set the tone for the next move. The 24-hour trading volume stands at $4,345,757,897, and the total market capitalization is currently at $22,157,350,819.The cryptocurrency pair ranks #6 in the market.
Binance Coin price analysis on a 1-day price chart: Bearish signal continues
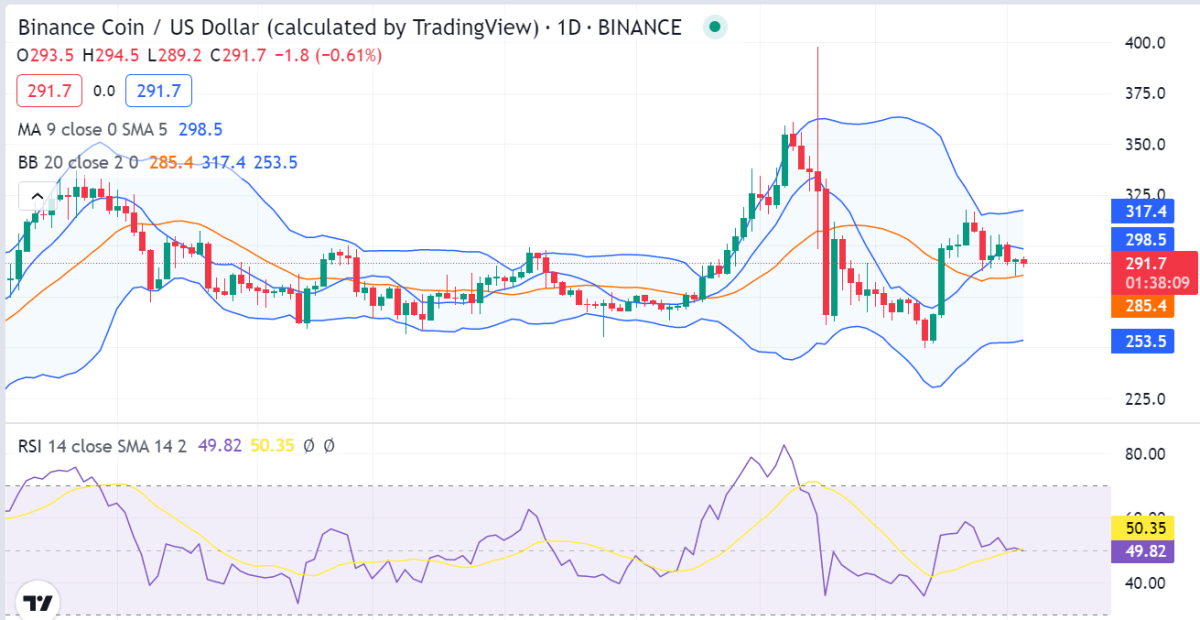
The 1-day Binance Coin price analysis confirms a downward price movement for today as the price has declined to $1.00. The market has been trading inside a descending channel since the start of today’s session. The BNB/USD pair price dipped below the support line and found interim support at $0.9995.

The Relative Strength Index (RSI) indicator has marginally reduced as well because of the decrease in price and is present at an index of 50.35, which indicates that the market is neither overbought nor oversold. The Bollinger band indicator shows strong volatility, the upper and lower Bollinger bands, which signify the resistance and support for BNB, are at $317.4 and $253.5 respectively. The price has been trading below the moving average (MA), which is present at $298.5.
BNB/USD 4-hour price chart: recent developments and further technical indications
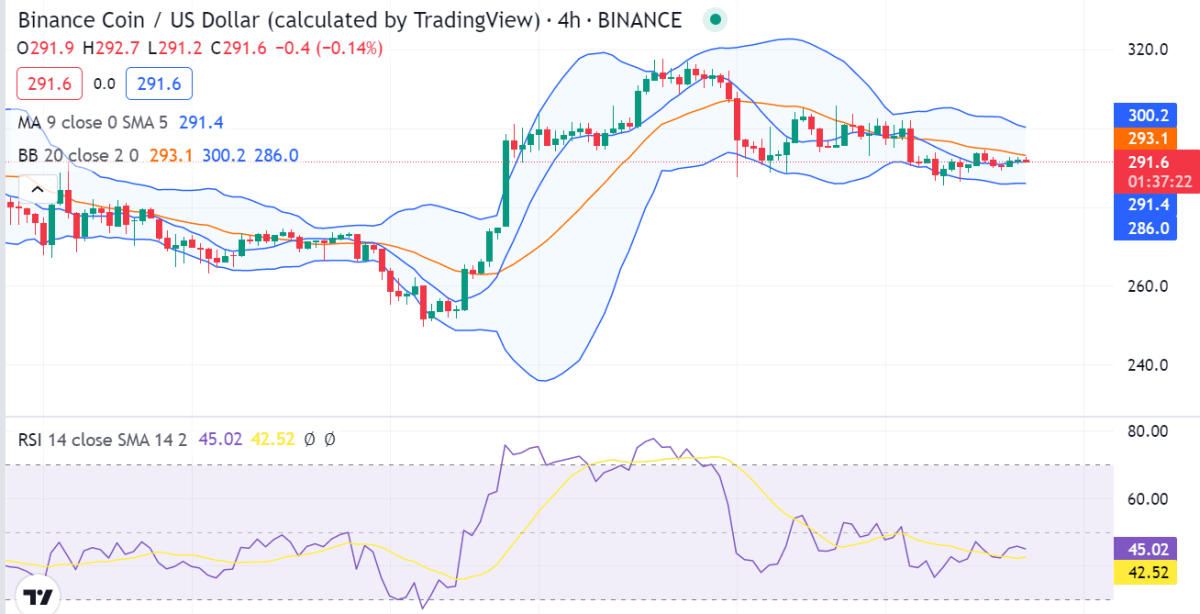
The 4-hour Binance coin price analysis is displaying bearish indicators as the price has dropped to the $1.00 level. The price has decreased significantly as the bearish momentum has been intensifying for the last few days. The moving average in the four hours price chart is standing at the $291.4 level. The volatility has been rising during this time, and the Bollinger bands are currently expanding.

The upper Bollinger band is now at $300.2, whereas the lower Bollinger band is situated at the $ 286.0 level, and if the downfall continues, then soon the price will travel below the MA level. The RSI score is going in the same direction and has decreased to 42.52, which demonstrates that market bears are in charge.
Binance Coin price analysis conclusion
The price experienced bearish progression today, as confirmed by the one-day and four-hour Binance coin price analysis. The bears are set on track as they have been able to bring the price down to the $1.00 level in the last 24 hours as the trend remained bearish throughout the day. It can be expected that the cryptocurrency will continue its bearish descent in the coming hours.
Disclaimer. The information provided is not trading advice. Cryptopolitan.com holds no liability for any investments made based on the information provided on this page. We strongly recommend independent research and/or consultation with a qualified professional before making any investment decisions.
0
0


