This Bitcoin 2019 Fractal Pattern Indicates Possible Price Drop Pre-Halving
4M ago•

bullish:
0
bearish:
1
Share
Following the successful approval of the spot Bitcoin ETF by the SEC, the eyes of cryptocurrency market participants are slowly turning to the second biggest event of 2024 – the BTC halving. Reducing the reward for miners of the Bitcoin network by half has historically catalyzed a mature bull market.
However, high volatility has historically characterized BTC price action in the weeks and months leading up to the halving event. 2016 Bitcoin experienced a large surge, only to undergo a correction immediately following the halving. In 2020, on the other hand, deep declines occurred 2 months before halving and were associated with the COVID-19 crash.
The dynamic increases in the BTC price that have continued since the beginning of 2023 may make the latter scenario more likely. The cryptocurrency market is quite heated today, and many analysts are looking for signals of a deeper correction. Should we expect drops in anticipation of halving BTC?
Correction Before Halving Will Repeat 2019
The current situation on the BTC price chart shows numerous technical similarities with the 2019 fractal. If the scenario from the previous cycle materialized now, Bitcoin could fall by as much as 53% and record the $23,000 level again.
Events in the months leading up to the 2020 halving were quite dramatic. At the end of the 2017 bull market, the price of BTC reached a historic all-time high (ATH) just below $20,000. Then, the bear market drove the price to a macro bottom at $3,215 in December 2018, resulting in an 84% decline.
Read More: What Is Bitcoin Halving?
Later, the Bitcoin price rose to a local peak of $13,764. It was located in the golden pocket area defined by the 0.5-0.618 Fib elimination of the entire downward movement (blue circle).
It turned out that this local peak initiated a deeper correction, the first target of which was again the 0.618 Fib elimination for the upward movement. Bitcoin fell to a low of $6477 and lost 53%.
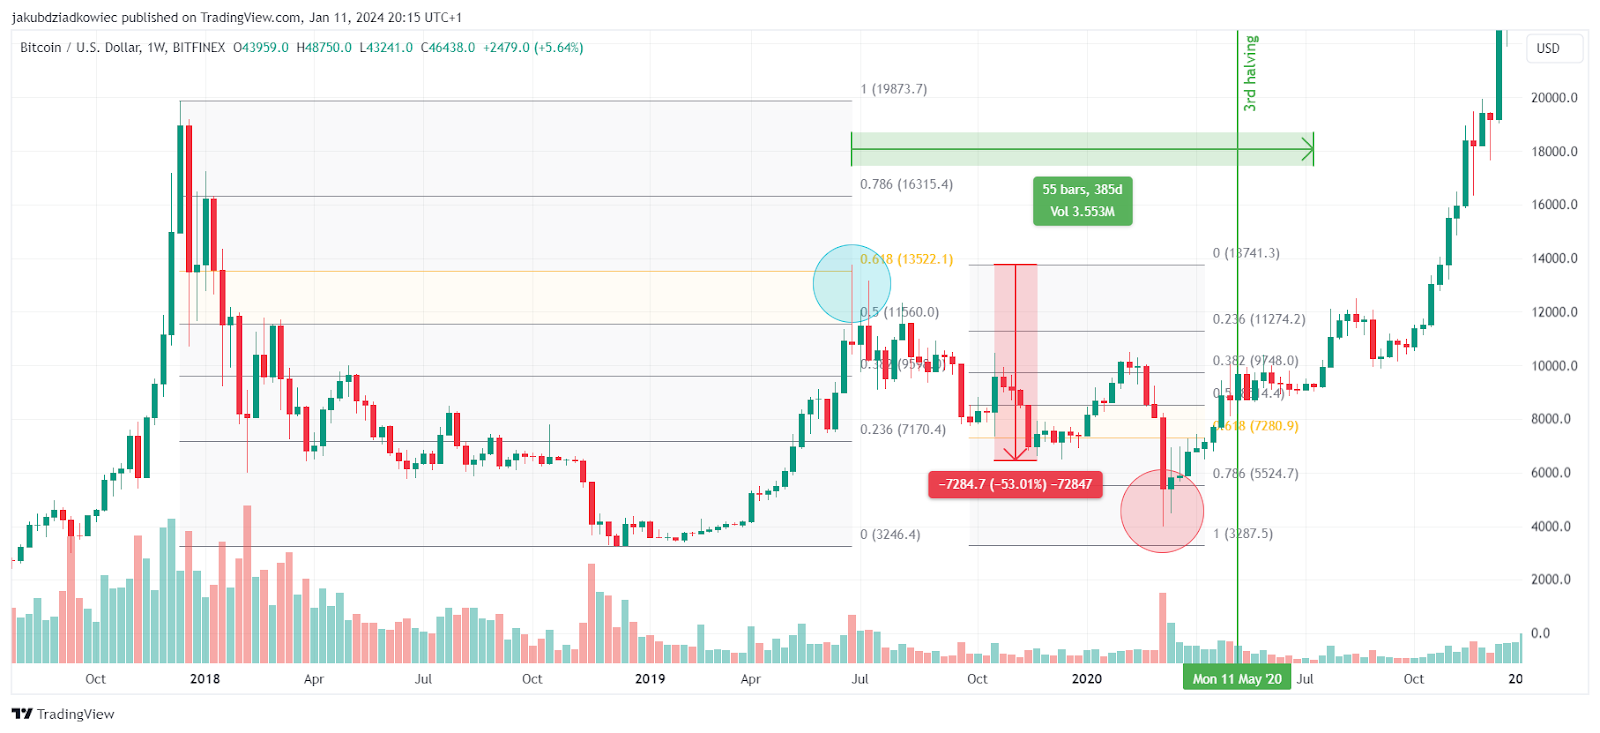 BTC/USD chart by Tradingview
A rebound began with this standard market correction, which could last until the halving scheduled for May 2020. However, a black swan and a crash in the global markets due to the COVID-19 pandemic led to another bottom. Bitcoin briefly plunged again to the $4,000 level, generating a long-term double-bottom pattern (red circle).
However, just a few weeks later, it recovered around $9,000, and this price held directly before and after the May 2020 halving. Interestingly, the mature bull market did not begin until July 2020, 55 weeks (more than a year) after the local 2019 peak (blue circle).
Will the 2019 Fractal Play Out in 2024?
The current technical situation on Bitcoin’s long-term chart is very similar to that of 2019. Ongoing increases have also just led the BTC price to the gold pocket area and a local peak at $48,750 (blue circle). Interestingly, reaching this macro level coincides with the approval of the spot Bitcoin ETF.
If this area serves as a local peak, we can expect the start of a deeper correction in the cryptocurrency market. If the BTC price were to drop again to the 0.618 Fib retracement for the entire upward movement, the move down would lead to the $28,000 level.
However, if the decline were to deepen and reach 53% – similar to the previous cycle – Bitcoin could see a bottom in the $23,000 area. This support level coincides with another important 0.786 Fib retracement.
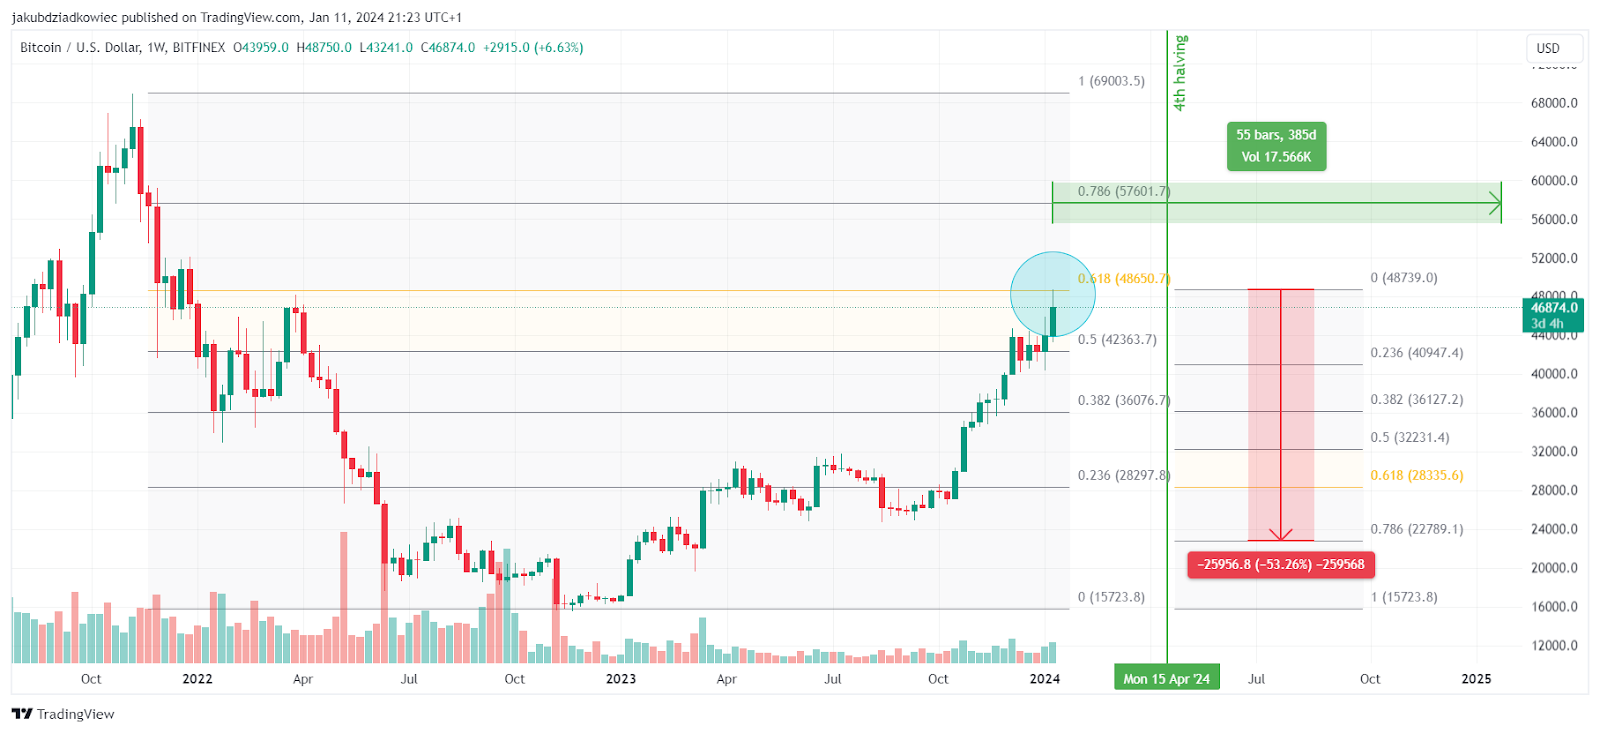 BTC/USD chart by Tradingview
If, on the other hand, time similarity were also to be kept between the current market and the previous cycle, the start of a mature bull market would not be expected until 55 weeks from now. This period does not occur until January 2025.
Read More: Bitcoin Halving Cycles and Investment Strategies: What To Know
For BeInCrypto’s latest crypto market analysis, click here.
4M ago•
bullish:
0
bearish:
1
Share


 Manage all your crypto, NFT and DeFi from one place
Securely connect the portfolio you’re using to start.

bullish:
0
bearish:
0

bullish:
0
bearish:
0

bullish:
0
bearish:
0

bullish:
0
bearish:
0