Daily Market Review: BTC, ETH, OP, AR, STRK
15d ago•

bullish:
0
bearish:
0
Share

Today’s market session has seen bears retake control due to the drop in the global market cap. The total cap stood at 2.33T as of press time, representing a 1.12% decrease within the last 24 hours, and the trading volume stood at $52.09B, representing a 23% drop over the last 24 hours.
Bitcoin Price Review
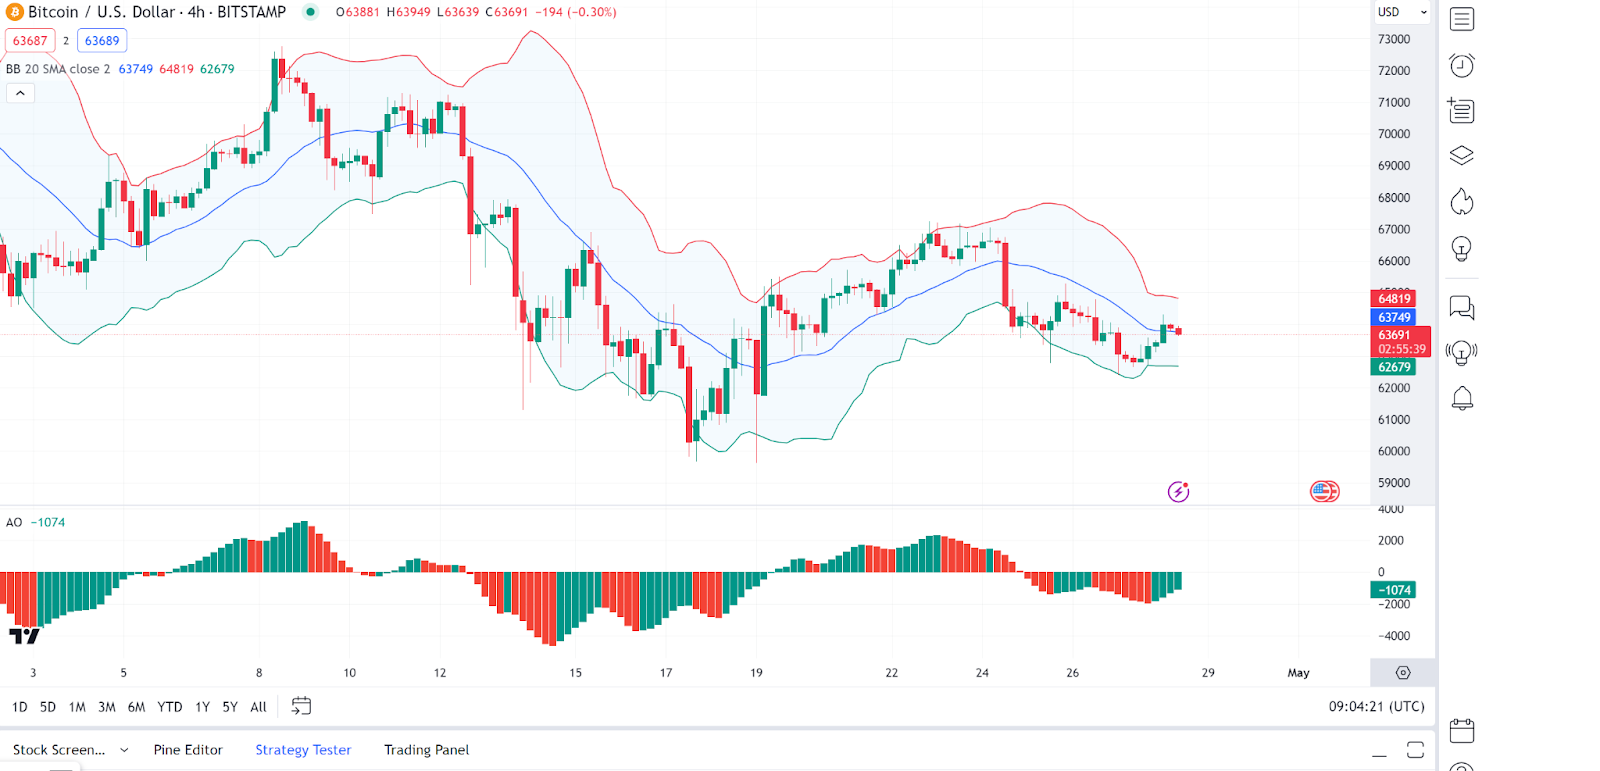
However, Bitcoin (BTC) has gained some in today’s session despite the general downtrend. The recent *BTC* price movement is toward the lower band, indicating potential support around that area. If the price consistently stays near or breaches the lower band, it could signal an oversold condition and a possible reversal if other factors align.
On the other hand, the Awesome Oscillator (AO) shows a series of red bars, indicating bearish momentum. The fact that the bars are below the zero line and increasing in length suggests that the bearish pressure is strong. As of press time, the Bitcoin price stood at $63,716, representing a 1.2% increase from its previous 24-hour price.
Ethereum Price Review
Ethereum (ETH) is also a gainer in today’s session as evidenced by its price movements. Looking at the Alligator indicator, the lines seem intertwined with no clear direction, often indicating a range-bound market or the possibility of forming a trend. The recent candles are above all three lines, indicating a potential uptrend.
On the other hand, the RSI is around 71, which is in the overbought territory. This could indicate that a correction or consolidation may follow. As of press time, the *ETH* price stood at $3,111, representing a 6.3% increase from its previous 24-hour price.

Optimism Price Review
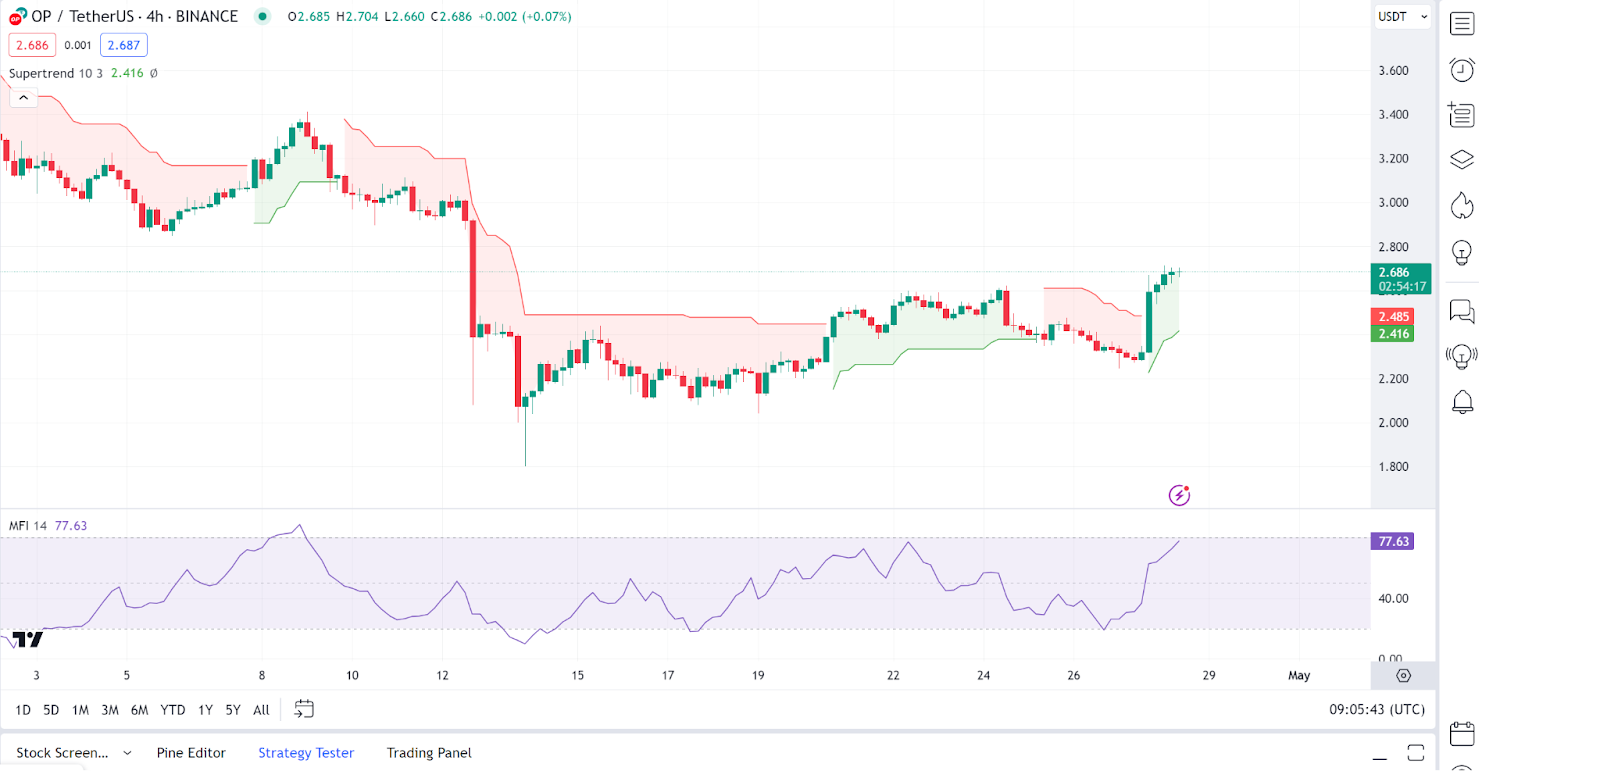
Optimism (OP) is among the top gainers in today’s session, as seen in its price movements. In an in-depth analysis, we see that the Optimism price is above the Supertrend line, which is green and suggests a bullish trend.
On the other hand, the Money Flow Index (MFI) is quite high at around 77.63, indicating that the market might be overbought. As of press time, the Optimism price stood at $2.68, representing a 16.85% increase from its previous 24-hour price.
Arweave Price Review
Arweave (AR) is also a top gainer in today’s session, as evidenced by its price movements. The Arweave price is above the cloud, which is green, indicating a bullish market. The recent candlesticks are above the conversion line (blue) and the baseline (red), further supporting the bullish signal.
On the other hand, Woodie’s CCI is above the zero line, which typically indicates bullish momentum. The red and green bars represent price momentum. As of press time, the Arweave price stood at $35.68, representing a 13.15% increase from its previous 24-hour price.

Starknet Price Review
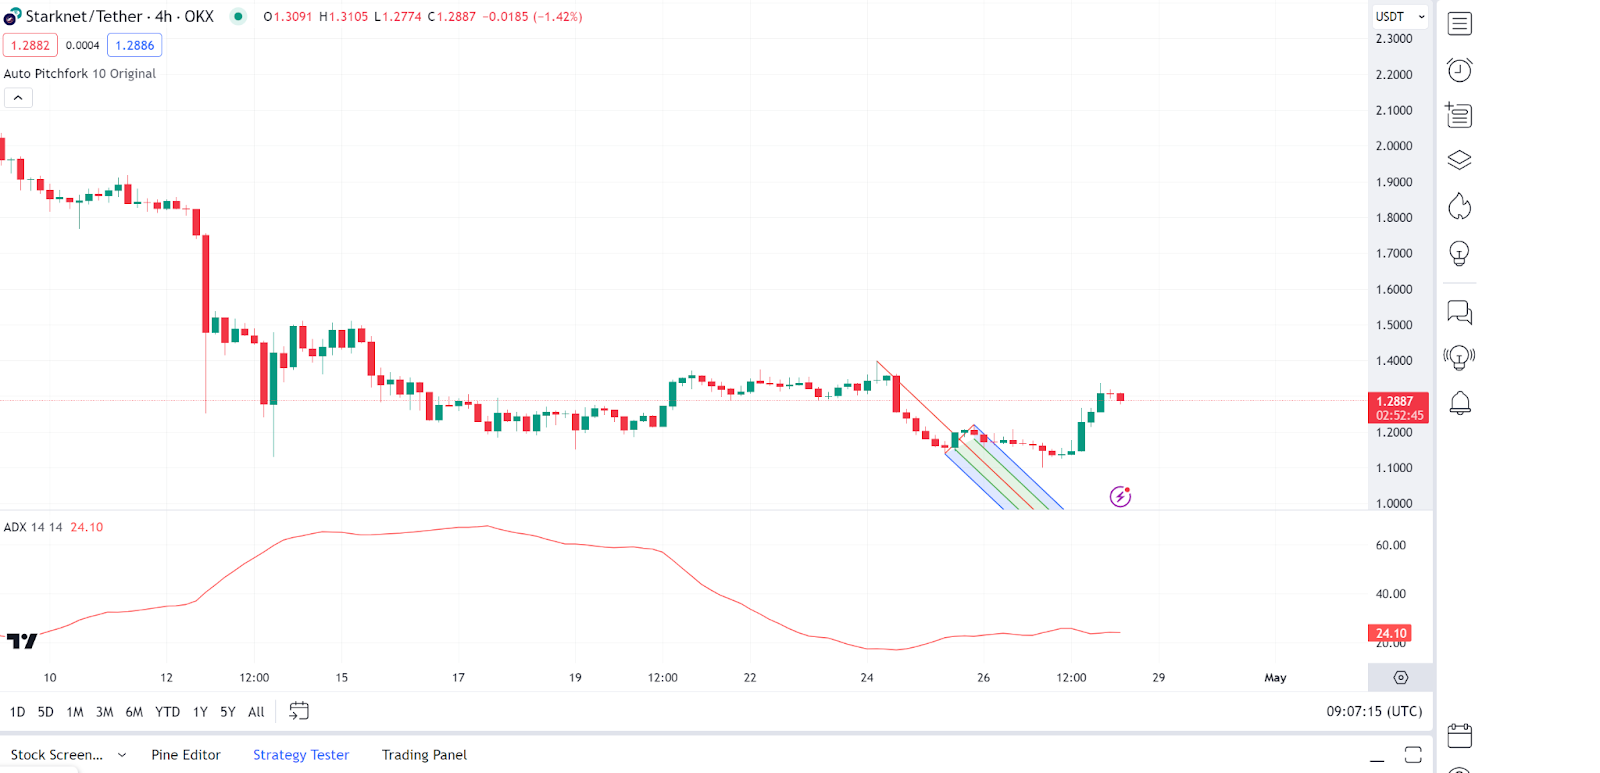
Starknet (STRK) is another gainer in today’s session as evidenced by the price movements. The Starknet price is within the pitchfork, which provides potential support and resistance levels. The recent price action is near the median line, which might act as support.
On the other hand, the Average Directional Index (ADX) is around 24, which suggests a weak to moderate trend strength. It is not high enough to tell a strong trend. As of press time, the Starknet price stood at $1.28, representing an 11% increase from its previous 24-hour price.
15d ago•
bullish:
0
bearish:
0
Share
 Manage all your crypto, NFT and DeFi from one place
Securely connect the portfolio you’re using to start.

bullish:
0
bearish:
0

bullish:
0
bearish:
0

bullish:
0
bearish:
0

bullish:
0
bearish:
0