
$DOGE Whales Are Back: Could Dogecoin Price Prediction Turn Bullish?

0
0

Dogecoin started out as a joke back in 2013, built off the Shiba Inu meme, and somehow turned into one of the most enduring names in crypto.
It's kept its spot among the largest coins by market cap for years now, helped along by celebrity attention and one of the most loyal communities in the space.
$DOGE is trading at $0.07035 at the moment, down close to 2% over the past day.
This dogecoin price prediction starts from that number, working through the 1h and 4h chart structures to map what a short-term move could look like from here.
Live Market Data
| Metric | Value |
|---|---|
| Current Price | $0.07035 |
| 24h Change | -1.8% |
| 24h High/Low | $0.07205 / $0.06892 |
| Market Cap | $10.938B |
| Fully Diluted Valuation | $12.043B |
| 24h Trading Volume | $399.376M |
| Circulating Supply | 155.474B |
| Total Supply | 171.185B |
Source: $DOGE market cap data taken from Coingecko, data as of Aug 13, 2026. Figures may vary slightly across other tracking websites.
Liquidation Snapshot
The last 24 hours saw about $2.44M in $DOGE liquidations, and longs took the bulk of it, $2.37M against just $69.54K on shorts. 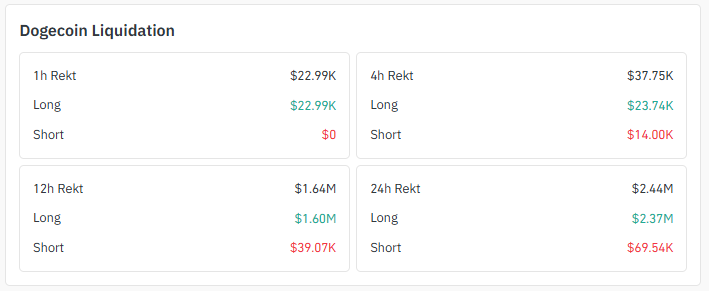
Source: Liquidation Data Taken From Coinglass.
That imbalance holds up across shorter windows too. The 1h window was entirely long-side at $22.99K, and the 4h window leaned long as well at $23.74K versus $14.00K short.
Recent price weakness has clearly caught long positions off guard more than shorts.
Exchange Volume
Binance dominates $DOGE derivatives volume at $390.65M, well ahead of the rest of the field. OKX follows at $227.19M, with MEXC ($98.53M) and Bybit ($124.15M) also contributing meaningfully.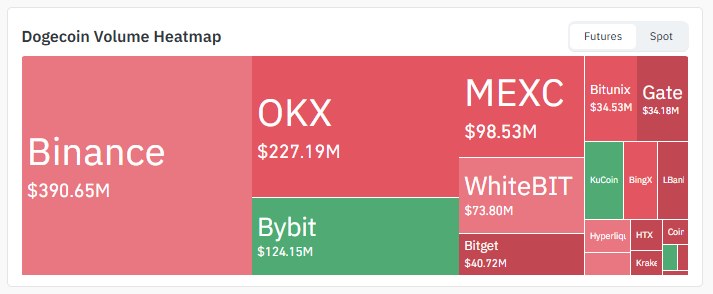 Source: Volume Heatmap Data Taken From Coinglass.
WhiteBIT, Bitget, Bitunix, Gate, and a handful of smaller venues round out the remainder.
That kind of concentration on Binance and OKX suggests most of the meaningful positioning right now is happening on the bigger platforms.
Social Sentiment of $DOGE
Community tracking on X points to notable whale accumulation recently, with reports of roughly 890 million $DOGE purchased over just two days, valued at around $62 million. 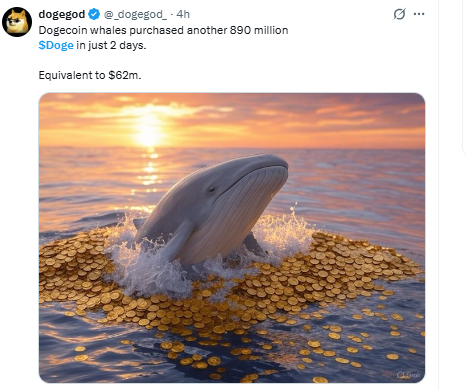
Source: Data Taken From @_dogegod_, X Account.
Large accumulation during a price dip like this one is often read as a sign of conviction from bigger holders, though it doesn't guarantee an immediate price reaction.
Worth watching whether that buying continues if $DOGE tests the lower end of its current range.
Key Takeaways
Forecast window: short-term, next 24–48 hours, based on 1h and 4h chart structure.
-
DOGE's sitting at $0.07035 right now, down 1.8% on the day. The price just bounced off a support zone on the 1-hour chart, so this level's already being tested.
-
On the hourly, DOGE is trading below a descending trendline. That line's been capping the last few pushes higher.
-
The 4-hour chart shows something more constructive underneath, an ascending channel that's still intact despite the pullback.
-
Clear the 1h trendline, and $0.07136 opens up first, with $0.07315 next. This view fails if the price loses the $0.06871 support zone.
-
Break the 4h channel's lower boundary instead, and $0.06890 comes into play, with $0.06764 as the deeper level if selling picks up.
Technical Analysis
1-Hour Chart: Trendline Rejection or Reclaim
The price on the 1-hour chart (Binance, DOGE/USDT) is trading under a descending trendline, and it just bounced off a support zone. This is the level to watch right now. 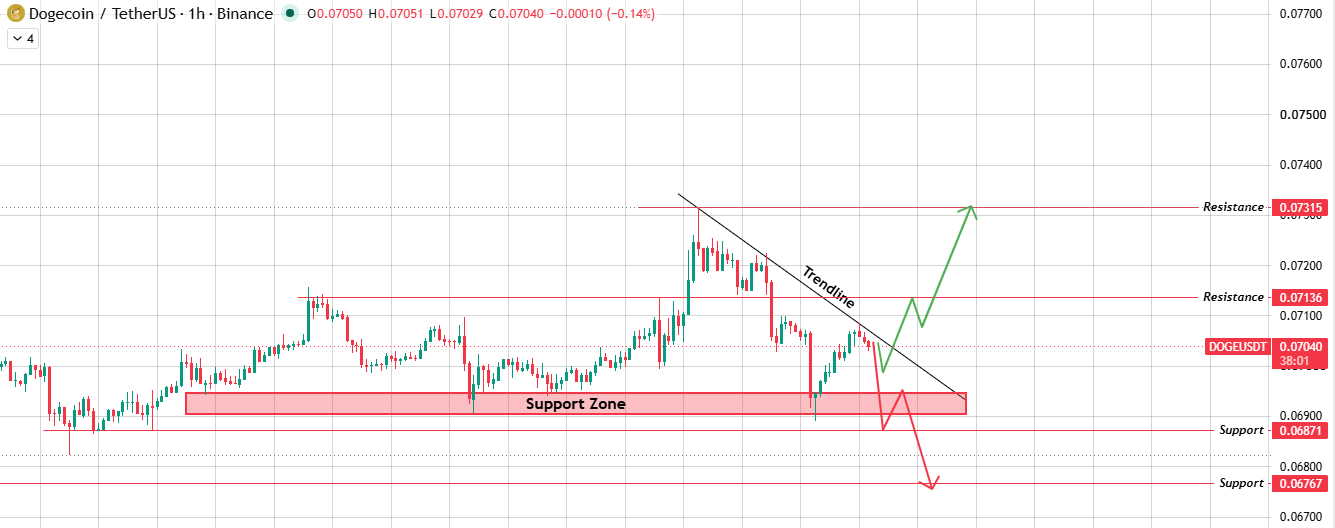
Source: Chart Taken From TradingView.
A clean break above the trendline puts $0.07136 in play as the first resistance, with $0.07315 next if buyers keep pushing.
Get rejected here again, though, and a break of the support zone opens the door toward $0.06767, going even deeper if momentum builds.
4-Hour Chart: Ascending Channel Still Intact
Zoom out to the 4-hour chart, and the structure looks more constructive. $DOGE's been riding an ascending channel, and the price is currently testing the lower half of that range near $0.07036. 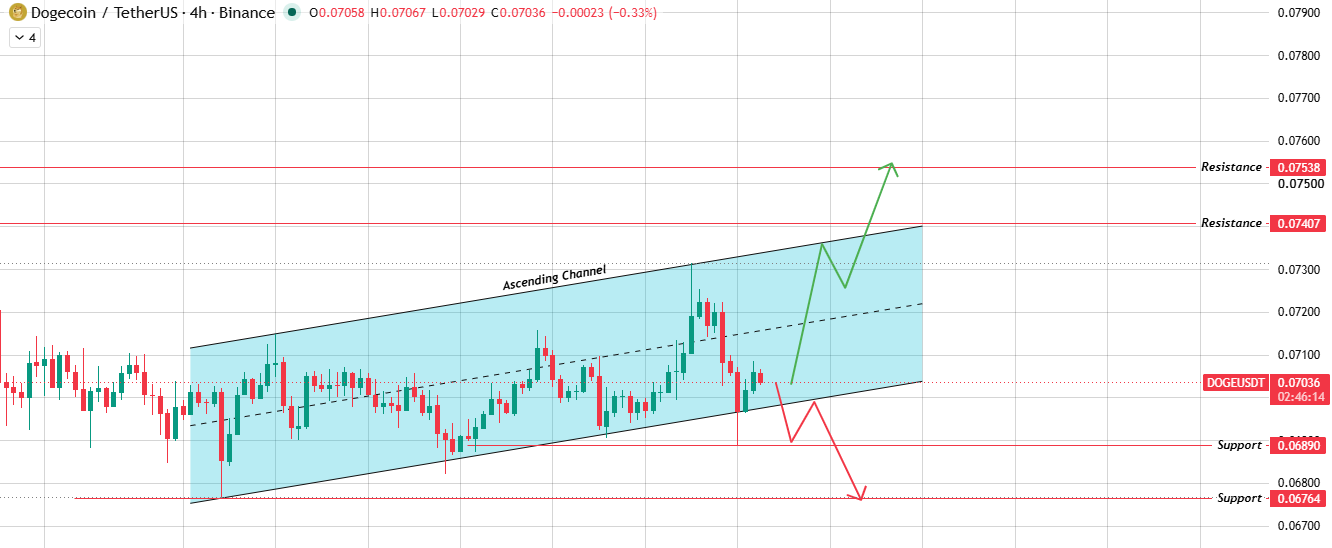
Source: Chart Taken From TradingView.
Clear the upper boundary of the channel, and $0.07407 becomes the level, stretching to $0.07538 if the move has real volume behind it.
Break the lower boundary instead, and support around $0.06890 comes in first, with $0.06764 as the deeper level below that.
Both charts are watching roughly the same zone right now, just from different angles. The $0.0687–$0.0690 area is doing a lot of work.
Bull, Base & Bear Case
| Scenario | Outlook | Invalidation |
|---|---|---|
| Bull Case | Break above the 1h trendline near $0.0710–$0.0714 opens a path toward $0.07136, then $0.07315. 4h channel support also holds. | Price closes back below $0.06871 support. |
| Base Case | $DOGE keeps chopping between the $0.06890–$0.06871 support zone and trendline resistance while the channel holds. | A confirmed daily close outside either boundary. |
| Bear Case | Rejection at the trendline plus a break of the $0.06871 support zone and 4h channel floor drags price toward $0.06764. | Price reclaims $0.07136 on a sustained basis. |
Glossary
A descending trendline connects a series of lower highs and typically acts as resistance until price breaks through it with conviction.
An ascending channel is a price structure that climbs between two parallel, upward-sloping trendlines.
A support zone is a price range, rather than a single line, where buying pressure has repeatedly stepped in.
Liquidation happens when a leveraged position is forcibly closed after losses exceed available margin.
Whale accumulation refers to large holders buying significant quantities of an asset, often seen as a signal of longer-term conviction.
Methodology
This dogecoin price prediction draws from 1h and 4h DOGE/USDT chart analysis on Binance, captured 13 Aug 2026, combined with live market data from CoinGecko, liquidation figures from Coinglass, and current exchange volume distribution.
Every price level referenced comes directly from the charts provided, with nothing extrapolated beyond what's visible.
This forecast should be revisited if $DOGE closes decisively outside the $0.0677–$0.0741 range.
Disclaimer: This article is for informational purposes only and should not be treated as financial or investment advice. Cryptocurrency markets are highly volatile, and price predictions carry no guarantee of accuracy. Readers should conduct independent research before making investment decisions.
0
0


 Manage all your crypto, NFT and DeFi from one place
Securely connect the portfolio you’re using to start.


0
0


0
0