
Zama Price Prediction: $ZAMA Breaks Out, Can Bulls Reach $0.060 Level?

0
0

ZAMA is showing real signs of life after weeks of quiet consolidation, and the chart is finally giving bulls something to work with.
Zama positions itself as a fully homomorphic encryption project for blockchains, according to the project's own materials.
This Zama Price Prediction looks at whether this breakout has real legs or whether it's simply an overbought spike after months of coiling inside a tightening range.
Keep reading to see what the chart is hinting at next.
Zama Price Prediction Market Overview
Metric | Value |
Price | $0.0510 |
24h Change | +19.2% |
Market Cap | $109.936M |
Fully Diluted Valuation | $549.681M |
24h Trading Volume | $68.45M |
Circulating Supply | 2.2B $ZAMA |
Total Supply | 11B $ZAMA |
Max Supply | Uncapped |
24h Range | $0.04068 to $0.05144 |
Source: Data from CoinGecko as of 23/07/2026. Figures may vary slightly across other tracking websites.
ZAMA Crypto News: Why Zama Is Rallying
The immediate driver behind the move is technical. $ZAMA spent from May through mid-July compressing inside a wedge, with each swing high and low pinching tighter than the last. 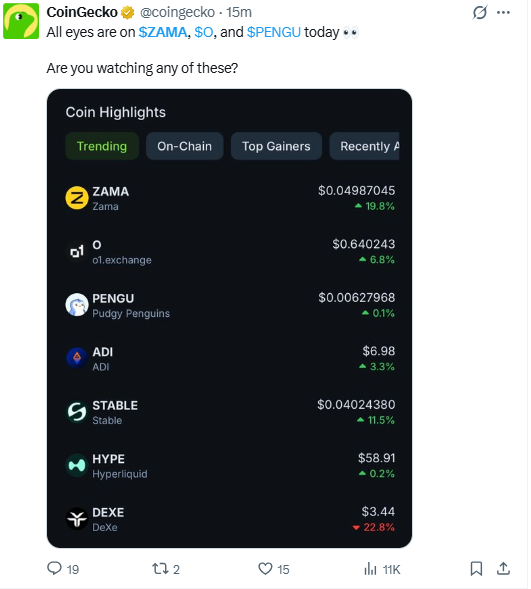
A report from Evening Trader Group points to on-chain wallet activity as the story behind $ZAMA's move, rather than a single news event.
According to this account, a top wallet, identified by the address 0x63DfE77CE186a69a43EbE5aB6625105e666dE9dC, had been receiving $ZAMA from Coinbase across multiple transactions over several months, quietly building a position while the token traded sideways.
The account frames this as a pattern worth recognizing: meaningful accumulation often happens during quiet consolidation, when price looks uneventful and volume is low, rather than during the visible rally that follows.
By the time a token expands sharply, as $ZAMA just did, the accumulation phase that set it up has usually already finished.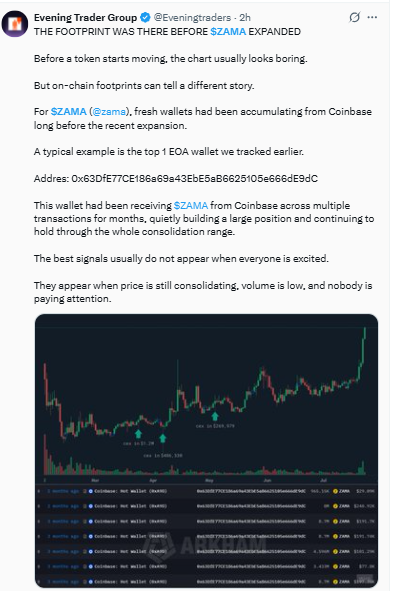
Source: Data From X
Note: This wallet tracking comes from a third-party account's own on-chain research, not an official ZAMA team statement or a primary data provider's confirmed analysis.
The wallet address and inflow pattern can be independently checked on a block explorer, but the claim that this specific wallet represents informed accumulation, rather than a market maker, exchange-related wallet, or other explanation, has not been independently verified.
Readers should treat this as one account's interpretation of on-chain data rather than a confirmed cause for the price move.
ZAMA price prediction 2026: Zama Chart Analysis
After breaking out of the triangle pattern, Zama moved sharply higher and is currently trading at $0.0510. This breakout is being measured against Fibonacci retracement levels drawn from the prior swing, which are also acting as target levels.
Price has already cleared the 0.5 retracement at $0.047196 and the 0.618 retracement at $0.050001, both of which now act as support above the current price.
The next hurdle is the 0.786 level at $0.053994, with the 1.0 level at $0.059203 sitting above that, and an extended 1.618 level far out at $0.073756.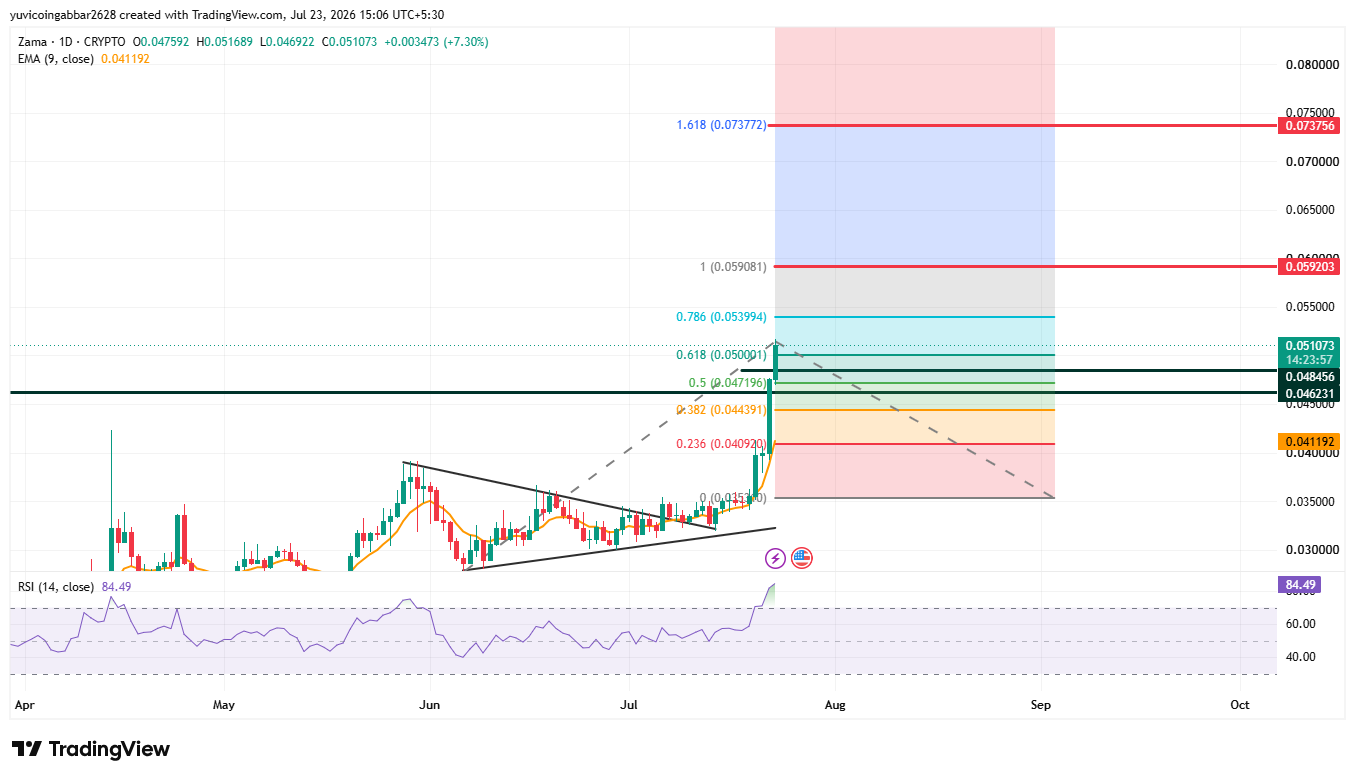
Level Type | Price |
Fib Extension (1.618) | $0.073756 |
Fib $Level (1.0) | $0.059203 |
Fib $Level (0.786) | $0.053994 |
Immediate price reference | $0.051073 |
Fib Level (0.618, broken resistance) | $0.050001 |
Fib Level (0.5) | $0.047196 |
Fib Level (0.382) | $0.044391 |
EMA 9 | $0.041192 |
EMA, or exponential moving average, weights recent candles more heavily than older ones, making it quicker to react to sharp moves.
The EMA 9 here sits at $0.041192, well below the current price, which confirms how far this breakout has pulled $ZAMA away from its short-term average. Meanwhile, RSI, or relative strength index, has spiked to 84.49.
Readings above 70 are generally considered overbought, so a reading in the mid 80s suggests the move has run hard and fast in a short window. That does not invalidate the breakout, but it does raise the odds of a pause or pullback before any further push higher.
Two Scenarios to Watch
Scenario | Level to Watch | Trigger | Timeframe | Invalidation |
Recovery Scenario | $0.053994 to $0.059203 | Daily close above 0.786 Fib with RSI cooling below 80 | 3 to 7 days | Rejection at $0.053994 with volume decline |
Breakdown Scenario | $0.050001 (initial recovery level, EMA reclaim zone) | Daily close back below 0.618 Fib | 2 to 5 days | Loss of $0.047196, the 0.5 Fib support |
Recovery Scenario
If buyers hold above the $0.050001 level and RSI works off some of its overbought pressure without price collapsing, the path toward $0.053994 stays open. A confirmed close above that level would put $0.059203 in view next.
Breakdown Scenario
If momentum fades and sellers push price back under $0.050001, that would mark a loss of the broken resistance turned support. A deeper slide toward $0.047196 would suggest the breakout needs more time to consolidate before trying again.
Risk Note
RSI at 84.49 is a genuine overbought signal, not background noise. Moves this stretched often see a cooling-off period, whether through a sideways pause or a pullback toward broken resistance.
Traders watching this setup should treat the current extension as elevated risk territory rather than confirmation that the rally continues in a straight line.
Zama Price Prediction Expert View
According to CoinGabbar analysts, the structure here favors bulls in the medium term, since the wedge breakout is confirmed and price has already reclaimed two Fibonacci levels.
But the RSI reading means the immediate next move is uncertain. A grind toward $0.053994 with occasional dips back to $0.050001 would be a healthier pattern than a straight vertical continuation.
The $0.060 level referenced in this Zama Price Prediction sits just above the 1.0 Fib extension at $0.059203, making it a meaningful level rather than an arbitrary round number.
Disclaimer
This article is for informational purposes only and does not constitute financial advice. Cryptocurrency markets are highly volatile, and prices can move sharply in either direction. Readers should conduct their own research before making any financial decisions.
0
0

 Manage all your crypto, NFT and DeFi from one place
Securely connect the portfolio you’re using to start.


0
0

0
0

0
0