
Solana Price Prediction: Can SOL Rally Toward $300 If Support Holds?

0
0

Solana is trading near $73 today, about 75% below its all-time high of $295 set in January 2025.
That kind of drop tends to split a market. Some traders see a rare buying zone. Others keep waiting for one more dip, hoping to catch the exact bottom.
A chart pattern is drawing fresh attention because of that split. It compares SOL's current price action to two earlier moments in its history.
What is SOL's price today?
SOL is trading around $73, per data from major exchanges. Its market cap sits near $42 billion, keeping it inside the top 10 cryptocurrencies by size.
That is a steep fall from the $295 peak hit in January 2025. Still, SOL sits far above its 2022 low near $8.
Why are traders calling $40 to $70 an accumulation zone?
Some chart watchers point to a setup called a breakout and retest. Price breaks an old high, pulls back to test that level as new support, then rallies hard.
The claim is that this has played out twice before for SOL.
In 2021, a similar setup came before a rally some chart analysts peg near 2,500%. In 2023, a similar pattern lined up before a run put at roughly 3,600%.
Whether the current pullback counts as a clean third setup is still an open question. Patterns do not repeat on command, and old rallies do not promise new ones.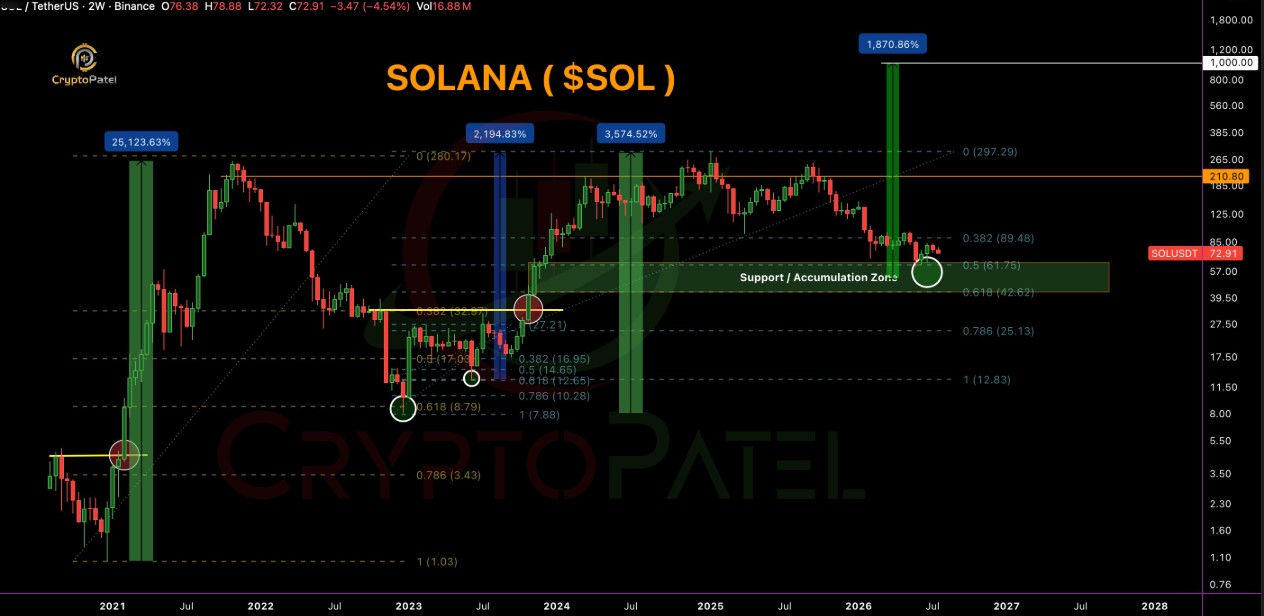
Here is how those two setups compare:
Cycle | Pattern | Approx. Rally After |
2021 | Breakout + retest | ~2,500% |
2023 | Breakout + retest | ~3,600% |
2026 (in progress) | Holding same support zone | Not yet confirmed |
What does the Elliott Wave count show for SOL?
One popular framework right now is Elliott Wave theory. It reads price charts as a series of up and down price swings, then tries to guess what comes next.
Under this reading, SOL finished a five-wave move up from about $0.50 in late 2020 to its 2021 top. It then fell in a corrective pattern that bottomed near $8 in December 2022.
From there, the count holds that SOL ran through another five waves up, this time from $8 to the $295 high in January 2025.
Since then, the theory says price has moved through an ABC correction. Wave A wrapped up in April 2025. Wave B ended in September 2025. Wave C, by this count, is still playing out.
What are the key support levels and price targets for SOL?
Chart followers using this wave count are watching a few Fibonacci levels closely. Fibonacci levels are price zones traders often treat as likely support or resistance.
Fibonacci Level | Price Zone | Status |
0.382 | ~$74 | Already tested |
0.5 | ~$48 | Possible reversal zone |
0.65 (golden pocket) | ~$28 | Deepest support in this count |
If price holds in this zone, the same analysis points to possible targets of $300, $500, $700, and even $1,000 over time.
Further out, some push a longer range target between roughly $2,200 and $3,200, tied to a much bigger wave count.
These are targets from one technical view, not guarantees. Prices can and do defy chart patterns.
What would invalidate this bullish Solana setup?
Every wave count needs an invalidation point. For this one, a drop under $7.99, the December 2022 low, would break the pattern completely.
Some traders use a tighter line. A monthly close under roughly $28 would, in their view, kill the bullish case before price even reaches that final low.
Does the new Solana ETF change the picture?
Real news is moving alongside the chart talk. Morgan Stanley launched a spot SOL ETF, ticker MSOL, on NYSE Arca in late July 2026.
It carries a 0.14% fee and shares out staking rewards.
It is one of the cheapest funds of its kind. That gives traditional investors a new way to get SOL exposure without holding the token directly.
That kind of institutional plumbing does not guarantee a price floor. But it does add a new source of demand alongside the chart-based case.
SOL's next move probably depends on both stories playing out together: the technical setup chart watchers are tracking, and the slow build of products like MSOL.
Nothing here is certain. Markets can and do break long-running patterns without warning.
Disclaimer
This article is for informational purposes only and is not financial advice. Cryptocurrency prices are highly volatile, and past performance does not guarantee future results. Always do your own research and speak with a licensed financial advisor before making investment decisions.
0
0

 Manage all your crypto, NFT and DeFi from one place
Securely connect the portfolio you’re using to start.


0
0


0
0