Will Hyperliquid Break $45 This Week?

0
0

Hyperliquid peaked at $43.5 a few hours ago. It surged to its highest value in the last seven days, but the hike was short-lived.
It soon retraced, now trading more than 2% lower than it opened the session. As previously highlighted in one analysis, this market movement ties mainly to fundamentals, especially those emerging from the Middle East.
Turning to geopolitics, while there is news related to the ongoing conflict, the general consensus is that peace talks have stalled. HYPE lost momentum as the US market reacted to these developments. Oil prices also surged in response, increasing the selling pressure on the crypto market.
The global cryptocurrency market cap also shed over 2%. Aside from this decline, the fear-and-greed index dropped to 42, down 4 points from the previous day.
Aside from fundamentals, other indicators explain why prices decline. One such is the Hyperliquid Long/Short ratio. In recent times, there has been a significant correlation between the number of traders in the platform and the price of its native token.
For example, when prices surge, the ratio increases as longs dominate. However, the reverse is true when the price declines. At the time of writing, traders are increasingly bearish. They are increasingly bearish despite the short hike in the early hours of Monday.
While the ratio does not predict where the price will go next, with shorts edging, prices may plummet further. It is also the same reading on the funding rates. It’s been positive for almost two weeks now, indicating price may retrace, leading to a long squeeze as seen a few hours ago.
Hyperliquid May Surge
Hyperliquid could surge amid the recent decline. This means that recovery may be near. The bollinger bands and the moving average convergence divergence are the basis for this conclusion.
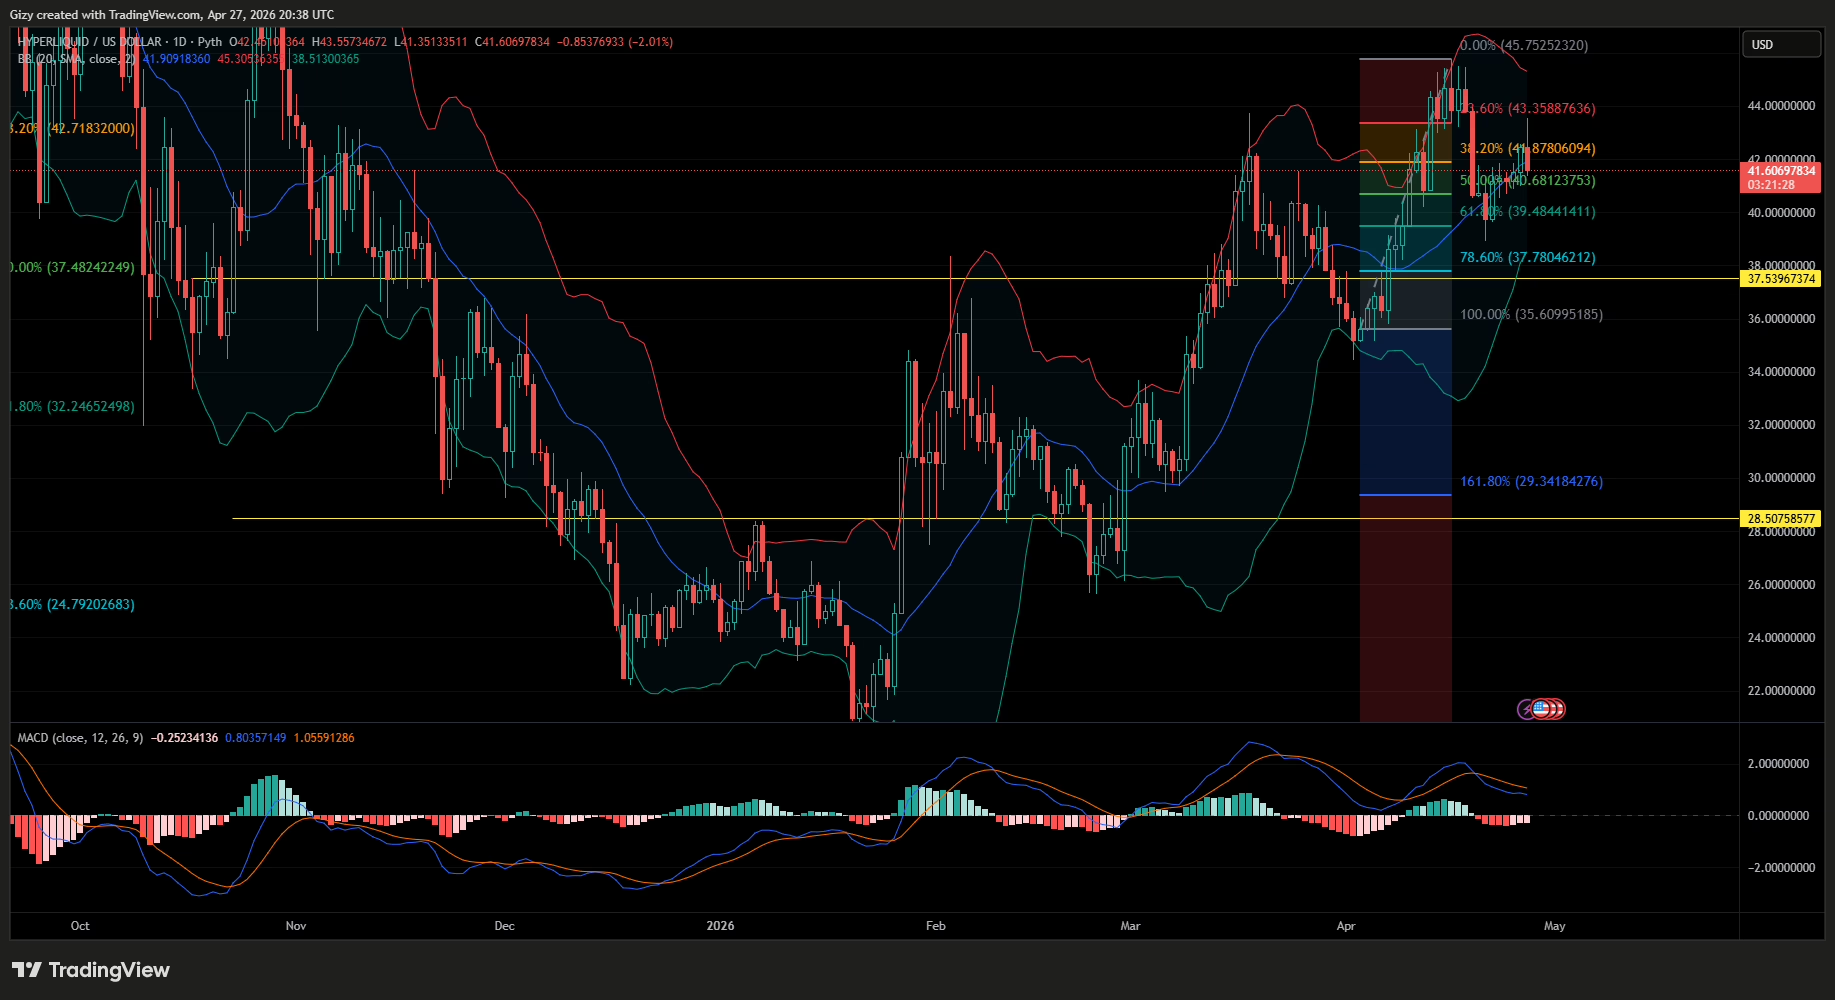
HYPE is trading slightly below the middle band. In hindsight, prices broke above the upper two weeks, retraced, then bounced off the SMA and have trended close to the metric since. Interestingly, prices have also trended upward since the rebound. If the trend continues, it will continue upward.
MACD makes the signal clearer as it is having a bullish convergence. Confirming the trend is its histogram, which printed shorter red candles over the last three days; a crossover may be imminent. While this does not definitively say prices will surge, it suggests that the asset is seeing notable buying that may lead to further increases.
With both indicators hinting at further increases, the unanswered question is how high it will go. The fibonacci retracement levels show that HYPE faced rejection at the 23% mark. Previous price movement show that notable selling congestion between $44 and $43. If prices break above this zone, a surge above $45 is highly likely.
However, it is worth noting that the asset is currently reacting to negative fundamentals. If it worsens, prices will retrace further. Hyperliquid will break the trend of trading close to the middle band.
The altcoin may retrace below the 50% fib level in the coming days. It may continue downward until it retests the 61% mark at $39.4. Nonetheless, the next move hinges on fundamentals; a positive one = recovery, while a negative one = further decline
The post Will Hyperliquid Break $45 This Week? appeared first on CoinTab News.
0
0

 Manage all your crypto, NFT and DeFi from one place
Securely connect the portfolio you’re using to start.

0
0

0
0

0
0

0
0