
Pendle Price Prediction August 2026: PENDLE Bull and Bear Case, Rally?

0
0

Pendle is drawing attention today after breaking down from a multi-week ascending channel just as its circulating supply hits an all-time low.
This Pendle Price Prediction August 2026 covers the channel breakdown, EMA and resistance levels, liquidation data, and the supply squeeze behind recent headlines.
Pendle is a yield-tokenization protocol that lets users trade future yield separately from principal, according to its own project materials.
Stay till the end for the full bull and bear case.
Pendle Price Prediction: Market Overview
Metric | Value |
Price | $1.4034 |
24h Change | −0.48% |
Market Cap | $240.96M (−0.45%) |
Unlocked Market Cap | $362.59M |
24h Volume | $25.57M (+3.68%) |
Vol/Mkt Cap (24h) | 10.56% |
FDV | $394.97M |
Liq/Mkt Cap | 2.16% |
TVL | $3.68B |
Market Cap/TVL | 0.06582 |
Total Supply | 281.52M $PENDLE |
Max Supply | No max supply set |
Circulating Supply | 171.75M $PENDLE |
Holders | 159.15K |
Profile Score | 70% |
Source: Data from CoinMarketCap as of 31/07/2026. Figures may vary slightly across other tracking websites.
Pendle Circulating Supply Update
The Token official account flagged that circulating supply has just hit an all-time low at 64.0% of total supply. 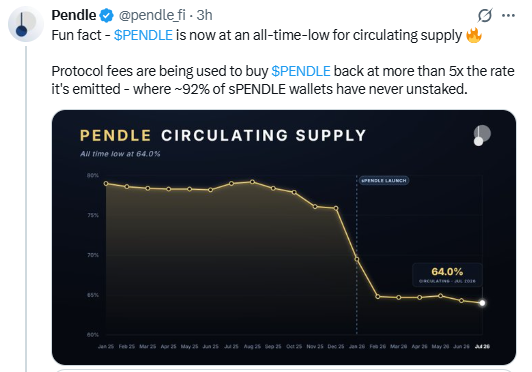
Source: Data From X
According to the post, protocol fees are being used to buy back $PENDLE at more than five times the rate it's being emitted, and roughly 92% of wallets have never been unstaked.
That's a meaningful supply-side tailwind, even with today's price sitting in the red.
Pendle coin prediction: Token Unlock Status
As of July 31, 2026, 91.8% of total supply (258.44M $PENDLE) is already unlocked, with just 8.2% (23.08M $PENDLE) untracked and effectively none reported as still locked. 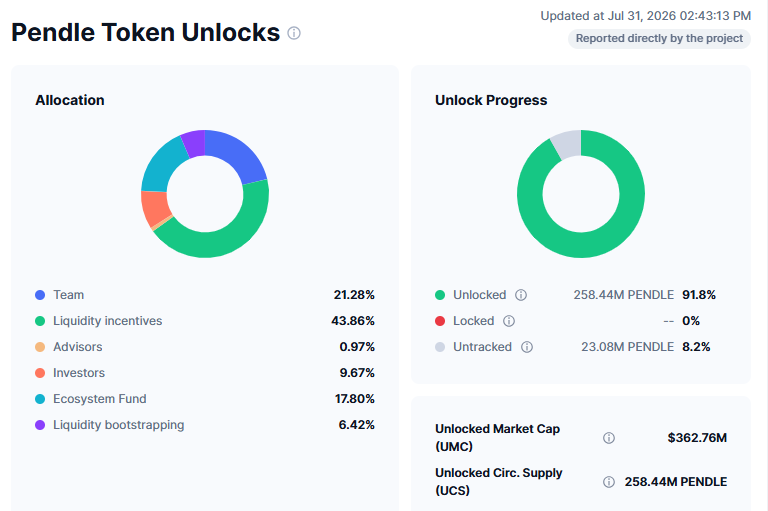
Unlocked market cap stands at $362.76M against 258.44M unlocked $PENDLE in circulation.
By allocation, liquidity incentives make up the largest share at 43.86%, followed by the team at 21.28%, the ecosystem fund at 17.80%, investors at 9.67%, liquidity bootstrapping at 6.42%, and advisors at 0.97%.
PENDLE Liquidation and Volume Data
Futures liquidations, per Coinglass, show a consistent short-side skew: 1h and 4h both total $1.56K, split $292.82 long versus $1.26K short; 12h totals $2.79K ($1.52K long, $1.27K short); 24h totals $7.23K, with shorts jumping to $5.67K against $1.56K in longs.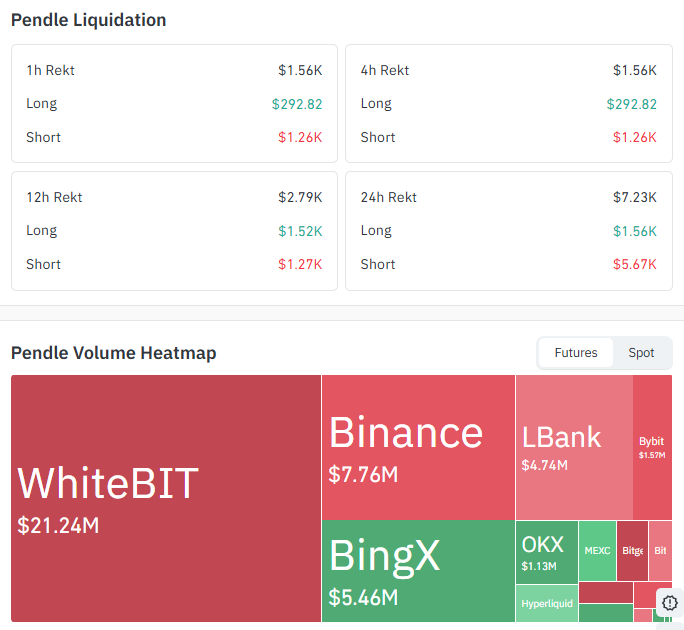
Source: Data From CoinGlass
That 24-hour jump in short liquidation lines up with a bounce attempt within the broader move.
On futures volume, WhiteBIT leads by a wide margin at $21.24M, followed by Binance ($7.76M), BingX ($5.46M), LBank ($4.74M), Bybit ($1.57M), and OKX ($1.13M), with smaller volume across MEXC, Bitget, Bitunix, and Hyperliquid. This is separate from the $25.57M spot volume in the overview above.
Pendle Prediction Chart: Technical Analysis
Pair: $PENDLE/USD · Market: Spot (Crypto) · Timeframe: 1D · Source: TradingView · Timestamp: July 31, 2026, 15:07 UTC+5:30
Price trades at $1.4034. The chart shows $PENDLE spent June consolidating in a range roughly between $1.20 - $1.45 before climbing into a tight ascending channel through late June and July.
That channel has now broken down, with the price sliding from its recent high near $1.63 back to $1.4034.
Current price sits below both key EMAs: the EMA 20 at $1.4920 and the EMA 50 at $1.4788, which have both flipped from support into overhead resistance now that price trades beneath them, separate from the horizontal resistance levels carried over from May.
If price fails to reclaim the EMA 20/50, the next resistance above that is the former channel high near $1.6320, followed by $1.9217 resistance and $2.1441 higher resistance from the May rally.
If the breakdown continues instead, the support levels below come from the June range floor and the April low of level $1.2051 support and then the next $1.0073 and more.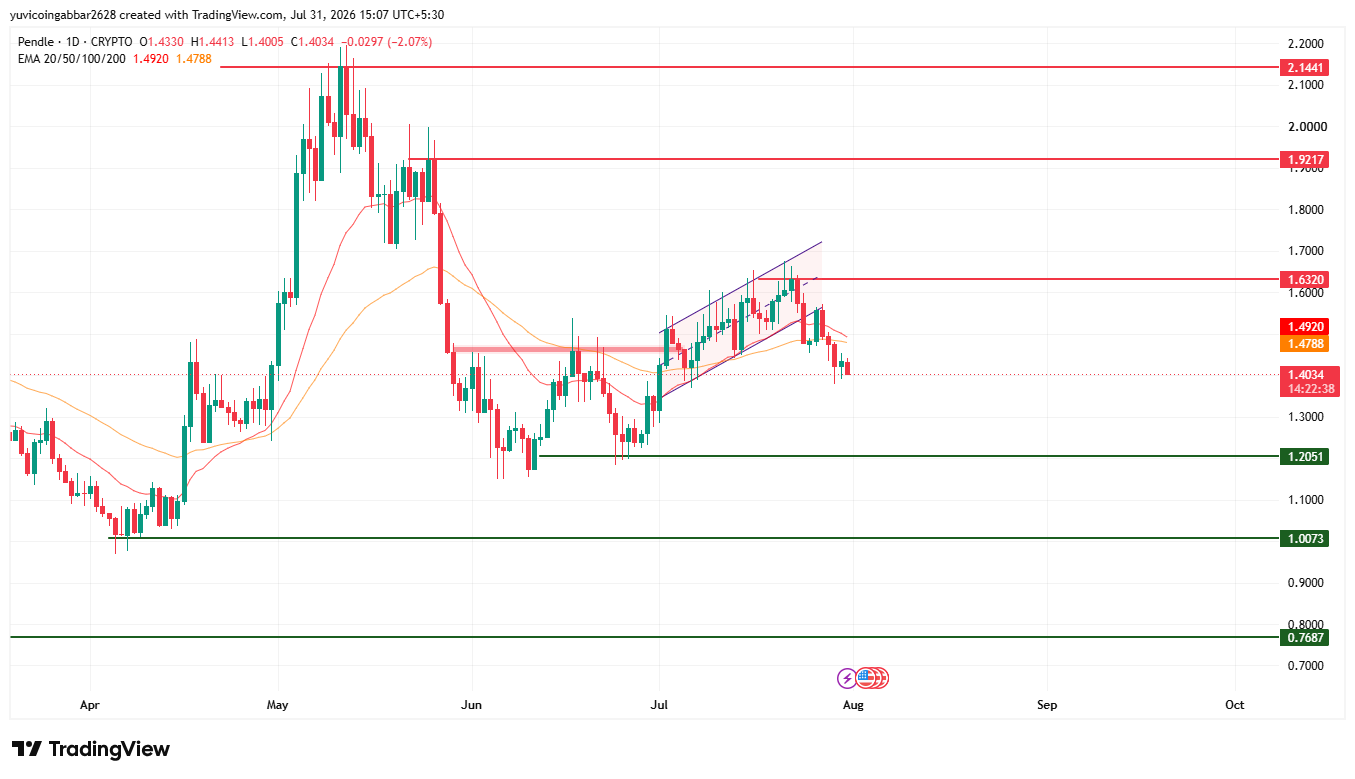
Level Type | Price |
Resistance 3 | $2.1441 |
Resistance 2 | $1.9217 |
Resistance 1 (former channel high) | $1.6320 |
EMA 20 (near-term resistance) | $1.4920 |
EMA 50 (near-term resistance) | $1.4788 |
Immediate Price Reference | $1.4034 |
Support 1 | $1.2051 |
Support 2 | $1.0073 |
Support 3 | $0.7687 |
The EMA 20 ($1.4920) and EMA 50 ($1.4788) are listed separately from the horizontal resistance levels above, since both EMAs now sit just above the current price. The structure stays bearish until the price breaks above $1.6320 and trades above both EMAs."
Pendle Forecast August 2026: Bull Case vs Bear Case
Bull case: If $PENDLE reclaims the EMA 50 at $1.4788 and then the EMA 20 at $1.4920, that would support a retest of the former channel high at $1.6320.
A break above that would open room toward $1.9217 and eventually $2.1441.
The circulating supply squeeze, with buybacks reportedly running at more than 5x emissions, adds a fundamental tailwind to this case.
Bear case: A continued slide below $1.4034, with short-side liquidations already picking up over the past 24 hours, would open room toward Support 1 at $1.2051, then Support 2 at $1.0073, with $0.7687 as the deeper level if the breakdown extends that far.
Can $PENDLE Reach the Price Target of $1.9217?
A move to $1.9217 would require price to first reclaim both the EMA 20/50 resistance cushion and the former channel high at $1.6320, then hold above that zone on a sustained basis.
That would effectively mean the price recovering the full May-to-July rally structure rather than just bouncing off a single level.
What Could Invalidate this Bullish Forecast?
A confirmed daily close below $1.4034, together with short liquidations continuing at the pace seen in the past 24 hours, would undercut the near-term recovery case and point toward Support 1 at $1.2051.
A further break below that would open room toward $1.0073 and eventually $0.7687.
Pendle Short-Term Forecast: A Liquidation-Based Read
The jump in 24h short liquidations to $5.67K, up sharply from the $1.26K–$1.27K seen in the 1h, 4h, and 12h windows, per Coinglass, suggests leveraged shorts got squeezed during a bounce attempt within the broader downside move.
That's a modestly supportive signal for the near term, though it doesn't guarantee the EMA 20/50 resistance gets reclaimed.
Pendle Price Prediction August 2026 Methodology
This forecast draws on multiple inputs rather than a single chart pattern: the ascending channel breakdown, EMA positioning relative to price, horizontal resistance and support levels, recent liquidation activity, and the circulating supply and unlock picture. No single data point is treated as decisive on its own.
Pendle Price Prediction August 2026: Expert View
According to CoinGabbar analysts, chart shows a coin that broke down from a well-defined ascending channel just as its circulating supply hit an all-time low, with buybacks reportedly running well ahead of emissions.
The EMA 20 and EMA 50 sit just overhead as near-term resistance, separate from the larger horizontal levels carried over from the May rally.
The near-term question is whether $1.4034 holds as a base for a reclaim of those EMAs, or whether the breakdown extends toward the support levels below.
Pendle Price Prediction August 2026: Data Sources
Price, market cap, TVL, and supply data referenced from a CoinMarketCap-style tracker, snapshot taken July 31, 2026. Liquidation and futures volume data referenced from Coinglass, as of July 31, 2026.
Chart analysis (EMA, resistance, support) sourced from a 1D $PENDLE/USD chart on TradingView, timestamped July 31, 2026, 15:07 UTC+5:30. Circulating supply update sourced from a post by Pendle's official account (@pendle_fi). Token unlock data updated July 31, 2026, 02:43 PM.
Disclaimer: This piece is for informational purposes only and isn't financial advice. Crypto prices are volatile, and it's worth doing independent research before acting on any of the levels discussed here.
0
0

 Manage all your crypto, NFT and DeFi from one place
Securely connect the portfolio you’re using to start.

0
0

0
0

0
0

0
0