
Dogecoin Price Prediction: $14.6B DOGE Stays Strong, Can It Rally?

0
0

Dogecoin price prediction searches are rising again as $DOGE holds steady among the top 12 cryptocurrencies.
The meme coin that began as a joke over a decade ago is still one of the most widely traded assets in the crypto market.
$DOGE is trading near $0.09364, up 0.5% in the last 24 hours. Its market cap is around $14.617 billion, which keeps it at #12 by market cap.
The Dogecoin price today shows a market that is quiet but stable.
Live $DOGE Market Data
Metric | Value |
Price | $0.09364 |
24H Change | +0.5% |
24H Range | $0.09179 - $0.09532 |
Market Cap | $14.617B |
24H Trading Volume | $1.005B |
Circulating Supply | 156.112B |
Source: market data taken from CoinGecko, as of Sep 29, 2026. Figures may vary slightly across other tracking websites.
Dogecoin Hourly RSI Signal
A post shared on X by Trader Tardigrade highlighted a repeating pattern on the hourly chart.
Each time the hourly RSI dipped into the oversold zone and recovered, $DOGE reversed higher within a short time. The latest dip is the fourth in the series.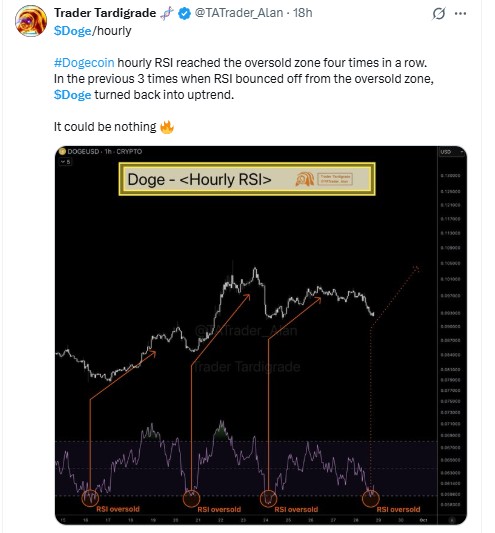
Source: Data taken from @TATrader_Alan, X Account, as of Sep 29, 2026
An oversold reading on a lower timeframe only shows that selling pressure may be stretched. It does not confirm a trend change. The bigger structure on the 4-hour chart still needs to agree with it.
Dogecoin Chart Technical Analysis
This Dogecoin technical analysis starts with the pattern squeezing price right now.
On the 4-hour chart, $DOGE sits inside a symmetrical triangle. The pattern forms when a falling trendline from above and a rising trendline from below meet at a point.
Price recently tested the rising trendline near $0.09158 and bounced, and it is now trading around $0.09415 on the Binance DOGEUSDT chart.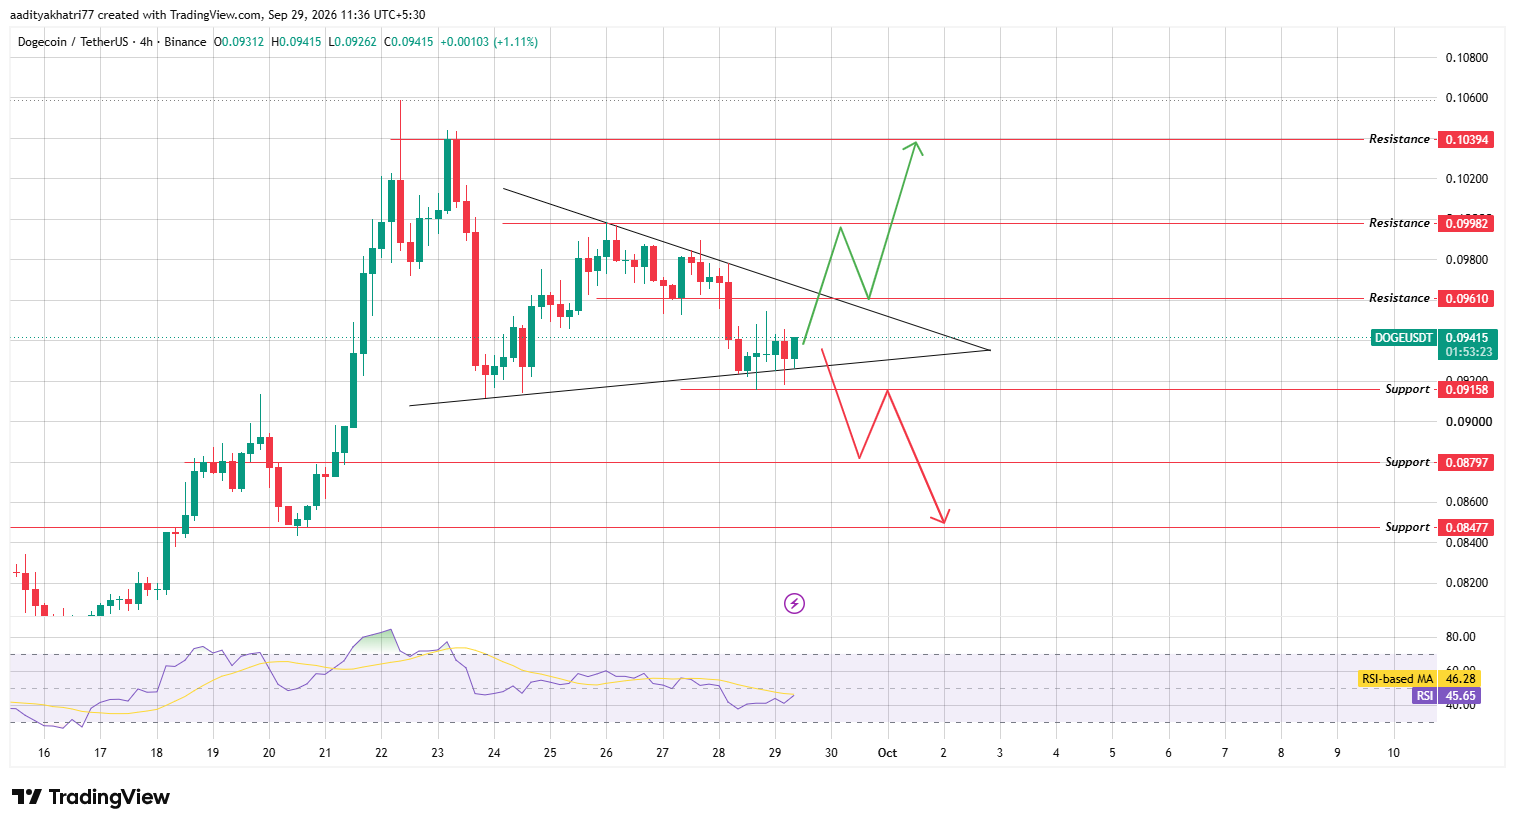
Source: Chart taken from TradingView, as of Sep 29, 2026
RSI reads 45.65, just below its moving average of 46.28. That is a neutral to slightly soft reading, but the indicator has started to turn up from its recent low.
This matches the oversold bounce mentioned above, though momentum is not strong yet.
Can $DOGE Push Toward Higher Resistance?
The bullish setup needs to happen in steps. First, $DOGE has to bounce and clear the $0.09610 resistance. Next, it needs a 4-hour close above the falling trendline of the triangle, backed by real volume.
If that happens, the first upside target is $0.09982. A stronger push can extend the move toward $0.10394, which is the major resistance on the chart.
That is the bullish case, and it needs volume behind the breakout, not just a wick above the line. A weak breakout without volume can easily fall back inside the triangle.
What Happens If $DOGE Breaks the Rising Trendline?
The bearish setup works the other way. If $DOGE loses the rising trendline and then breaks the $0.09158 support, sellers can take control. In that case, the next downside target is $0.08797.
If that level also fails, $0.08477 becomes the next real support zone.
Breakdowns from tight triangles tend to move quickly once support gives way. That is the risk on the other side of this trade.
Support | Resistance |
$0.09158 | $0.09610 |
$0.08797 | $0.09982 |
$0.08477 | $0.10394 |
Bull, Base, and Bear Scenarios
Scenario | Setup | Level |
Bull | Resistance and falling trendline break with volume | $0.09982 to $0.10394 |
Base | Triangle holds, range trade | $0.09158 to $0.09610 |
Bear | Rising trendline and support break | $0.08797 to $0.08477 |
Dogecoin vs Bitcoin
Bitcoin's direction usually sets the tone for meme coins like DOGE in the short term. A risk-on market helps triangle breakouts hold above resistance.
A risk-off move tends to pull DOGE's support levels lower, no matter what an RSI pattern suggests. Against Bitcoin, DOGE is up 0.4% at 0.0₅1125 BTC, so it is holding its ground for now.
Methodology
This Dogecoin price prediction October 2026 was built from a 4-hour DOGEUSDT chart on Binance via TradingView.
The triangle boundaries, RSI, and RSI-based moving average were checked candle by candle.
Support and resistance levels came directly from the marked price zones on that chart.
Live price, market cap, volume, and supply figures came from a CoinGecko snapshot taken the same day.
The hourly RSI observation comes from a post on X and was treated as supporting context, not as a confirmed signal.
Nothing here substitutes for independent research. A chart pattern only describes probability, not certainty.
Expert Opinion
Market commentary around Dogecoin news today leans cautiously constructive. Traders point to the repeated hourly RSI bounces as an early sign that buyers step in on dips.
At the same time, the triangle is nearing its apex in early October, which makes the next breakout or breakdown the real test. A bounce means little if DOGE cannot clear $0.09610 with volume behind it.
Disclaimer: This article is for informational purposes only and does not constitute financial advice. Cryptocurrency markets, including Dogecoin, carry high volatility and downside risk; prices can move sharply against any projected level, and past performance offers no guarantee of future results. Readers should conduct independent research before making any investment decision.
0
0

 Manage all your crypto, NFT and DeFi from one place
Securely connect the portfolio you’re using to start.


