
Cardano Price Prediction Today: Is ADA About To Shock Everyone?

0
0

Cardano price prediction talk is picking up again as ADA sits in a spot that has already fooled a lot of traders once this month.
Sellers have tried and failed multiple times to force a breakdown here, and the way price keeps refusing to give up ground is exactly why this zone matters so much right now.
Quick Take: $ADA is trading near $0.166 on the 4-hour chart. A confirmed close above $0.1687 opens the path toward $0.1808 and $0.1900, while a close below $0.1605 shifts focus down to $0.1553.
This is a 4-hour read and should be rechecked if the price closes decisively beyond either level.
$ADA Price Right Now And Market Snapshot
Metric | Value |
Price | $0.166 |
24h Change | +0.48% (+$0.001503) |
Market Cap | $6.07B |
Futures Volume (24h) | $193.27M |
Spot Volume (24h) | $23.95M |
Open Interest | $399.57M |
Circulating Supply | 36.48B ADA |
Total Supply | 44.99B ADA |
Max Supply | 45.00B ADA |
The price is taken from the live TradingView chart, with volume, market cap, open interest, and supply figures from Cardano data on the CoinGlass ADA market page, as of July 27, 2026, 13:00 IST.
Methodology And Data Sources
This $ADA technical analysis uses the 4-hour ADA/USDT chart on Binance via TradingView for price structure, with volume, open interest, and market cap figures from CoinGlass and liquidation flow from CoinGlass's ADA liquidation tracker.
All levels are treated as invalidated only on a confirmed 4-hour candle close beyond the stated trigger, not an intraday wick.
Why Is $ADA Price Moving Today
This Cardano price prediction is getting an extra push from comments made by the project's own founder. 
As per a BSCNews update on Charles Hoskinson's remarks, the Cardano founder argued that Ethereum needs to rely on charity since it is missing an on-chain treasury, something he described as structurally weak.
He pointed to Cardano's own onchain treasury model instead, which was once worth a staggering $4.5 billion, framing it as a real advantage over Ethereum's setup.
That kind of founder commentary tends to stir up sentiment either way, and combined with the current chart setup, it is adding extra eyes to ADA at a moment when the technical structure is already at a decision point.
$ADA Liquidation Data And Long Short Squeeze
Liquidation flow over the past day is leaning firmly toward longs getting caught out, a sign that buyers trying to call the bottom too early have kept getting stopped out.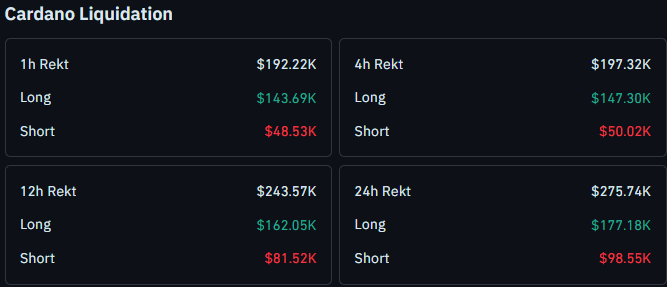
Over the past hour, $192.22K was liquidated, split between $143.69K in longs and $48.53K in shorts.
The 4-hour window shows a similar tilt, with $197.32K total made up of $147.30K in longs against $50.02K in shorts.
Zooming out, the 12-hour window shows $243.57K in total liquidations, with longs taking the bigger hit at $162.05K versus $81.52K in shorts.
Across the full 24 hours, liquidations reach $275.74K, and longs again dominate at $177.18K against $98.55K in shorts.
That consistent long-side skew fits a market where dip buyers have kept stepping in too early during the recent chop, only to get flushed before the real move plays out.
The complete breakdown sits on the ADA liquidations dashboard linked above.
$ADA Technical Analysis Ascending Trendline Flip Zone Setup
$ADA had been climbing along an ascending trendline on the 4-hour chart, and the structure looked clean through its first three taps. 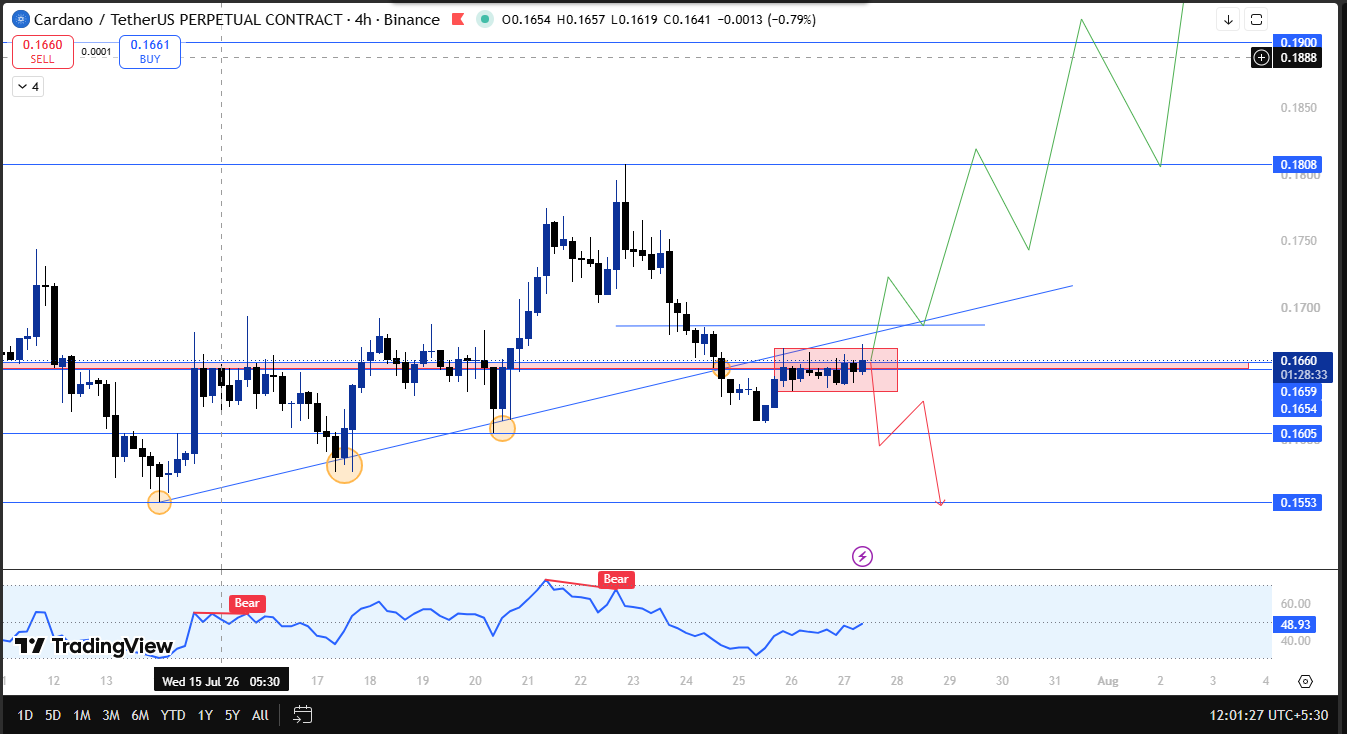
The second tap pushed the price almost back to the old high, and the third tap brought a genuinely strong upmove, enough that most traders were expecting a fourth tap to continue the same pattern.
Instead, $ADA broke that trendline directly and closed below it, catching the crowd expecting continuation off guard.
A pullback followed, and sellers then made four separate attempts to force a full breakdown from there. Every single attempt failed.
Price kept holding around a flip zone between $0.1654 and $0.1659 for almost two full days, refusing to give that level up despite repeated pressure, a pattern our ADA retest before rally coverage also flagged as a setup worth watching closely.
That kind of repeated defense of a level is usually a meaningful tell.
If $ADA breaks out and closes a 4-hour candle above $0.1687, that would confirm the flip zone held for good reason, opening the path toward $0.1808 and then $0.1900, a scenario also covered in our ADA ready to explode after Van Rossem update.
On the downside, if ADA breaks $0.1605 and closes below it, that would undo the flip zone defense and open $0.1553 as the next support, a level tracked in our ADA flip zone breakdown analysis.
The RSI on the 4-hour chart is sitting near 49, cooling off after two earlier bearish divergence tags during the run-up.
That cooling is fairly normal after the kind of chop ADA has been through, and it fits a market pausing to decide direction rather than one accelerating in either direction just yet.
$ADA Glossary Of Key Trading Terms
Ascending Trendline: A rising support line connecting a series of higher lows, used to track an uptrend's structure and see where buyers keep stepping back in.
Flip Zone: A price level that previously acted as resistance and, once reclaimed, starts acting as support instead, or vice versa.
RSI (Relative Strength Index): A momentum indicator that measures how fast and how far price has moved, often used to flag overbought conditions or early divergence.
Liquidation: What happens when a leveraged trade gets forcibly closed because the trader ran out of margin to keep it open.
Open Interest: The total value of outstanding derivative contracts, used to gauge how much leverage is active in a market.
Onchain Treasury: A protocol-level fund held and managed on the blockchain itself, used to finance development and ecosystem growth.
ADA Technical Snapshot Table
Indicator | Signal |
Trend | The trendline was broken after three clean taps; the price is now holding a flip zone instead |
Structure | Defending $0.1654 to $0.1659 for close to two days despite four breakdown attempts |
RSI | Near 49, cooling off after earlier bearish divergence during the uptrend |
Liquidations | Longs have been getting liquidated more than shorts across every window |
Key Trigger | 4h close above $0.1687 confirms strength; close below $0.1605 breaks the flip zone |
Broader Catalyst | Founder comments on Cardano's on-chain treasury model versus Ethereum's structure |
ADA Support And Resistance Levels To Watch
Type | Level | Note |
Resistance 2 | $0.1900 | Extended upside target |
Resistance 1 | $0.1808 | Next hurdle after a confirmed breakout |
Breakout Trigger | $0.1687 | Confirms flip zone strength on a 4h closing basis |
Current Price | $0.166 | Holding inside the flip zone |
Flip Zone | $0.1654 to $0.1659 | Defended four times over roughly two days |
Support 1 | $0.1605 | Breakdown trigger on a confirmed close below |
Support 2 | $0.1553 | Next support if $0.1605 breaks |
Risk-Reward Table For ADA Traders
Case | Trigger | Target |
Bull Case | 4h close above $0.1687 | Push toward $0.1808 and then $0.1900 |
Bear Case | 4h close below $0.1605 | Drop toward $0.1553 |
Invalidation Level For This ADA Setup
The flip zone defense on ADA stays meaningful as long as price holds above $0.1605 on a 4-hour closing basis.
A confirmed close below that level would break the zone that sellers already failed four times to crack, shifting focus down to $0.1553.
On the other side, a 4-hour close above $0.1687 would confirm the flip zone held for a real reason, supporting a move toward $0.1808 and then $0.1900, a continuation our ADA next move loading update also tracks.
Expert View On Cardano Price Prediction
Traders following this Cardano price prediction point out that the failed trendline continuation followed by four failed breakdown attempts is a notable structural tell, since sellers had every chance to press the advantage after the trendline break and simply could not.
The long, heavy liquidation pattern over the past day also suggests buyers stepping in too early rather than a market in genuine panic.
Combined with the founder's recent comments spotlighting Cardano's on-chain treasury model, sentiment has a modest tailwind heading into the next close, though the setup only confirms once $0.1687 or $0.1605 actually gives way, a theme our ADA broadening wedge, the flip zone piece, and ADA breakout analysis are all covered in more depth.
Disclamer:This technical analysis is for educational purposes only and shouldn't be treated as financial or investment advice. Crypto markets are highly volatile.
0
0

 Manage all your crypto, NFT and DeFi from one place
Securely connect the portfolio you’re using to start.

0
0


0
0