
Mantle Price Prediction: Will MNT Reach $1.5 Again?

0
0
Mantle's chart reads like a comeback story still waiting for its final act. $MNT has clawed back well above $0.5509, a level that stopped every earlier recovery attempt in its tracks, and for a moment it looked like the resistance had finally given way.
Zoom out, though, and the token is still boxed inside the same descending channel that has capped every bounce for months. This Mantle Price Prediction picks up right where that tension sits.
How Is Mantle's Market Story Unfolding Right Now?
$MNT is trading near $0.5734, up 11.21% over the past 24 hours, according to CoinMarketCap data.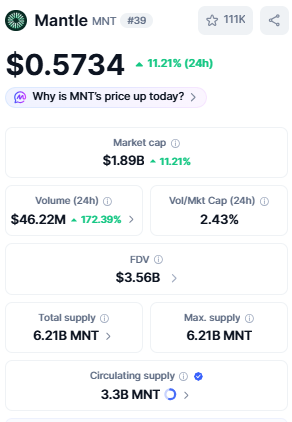
Market cap has climbed to $1.89 billion, moving in step with price, while 24-hour volume has surged 172.39% to $46.22 million, a sign fresh money is stepping in fast.
The circulating supply sits at 3.3 billion MNT out of a 6.21 billion maximum, putting the fully diluted valuation near $3.56 billion, a gap that keeps shaping how far this Mantle Price Prediction can realistically travel.
Is the Derivatives Market Adding Fuel to This Rally?
The derivatives tape adds its own chapter to the story. MNT is up 46.48% over 30 days, even though the 90-day and 180-day windows still show losses of 9.66% and 16.82%, and the coin remains down 40.29% year-to-date, according to Coinglass data.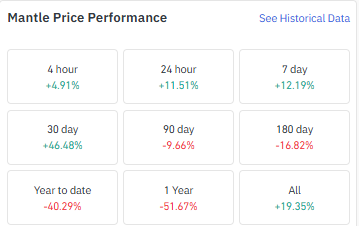
24-hour liquidations totaled close to $136.78K, with short positions taking the bigger hit at $107.74K against $29.04K on longs, suggesting sellers got caught off guard by the bounce.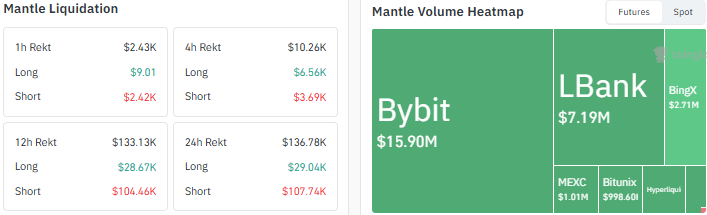
Futures volume is led by Bybit at $15.90 million, followed by LBank at $7.19 million.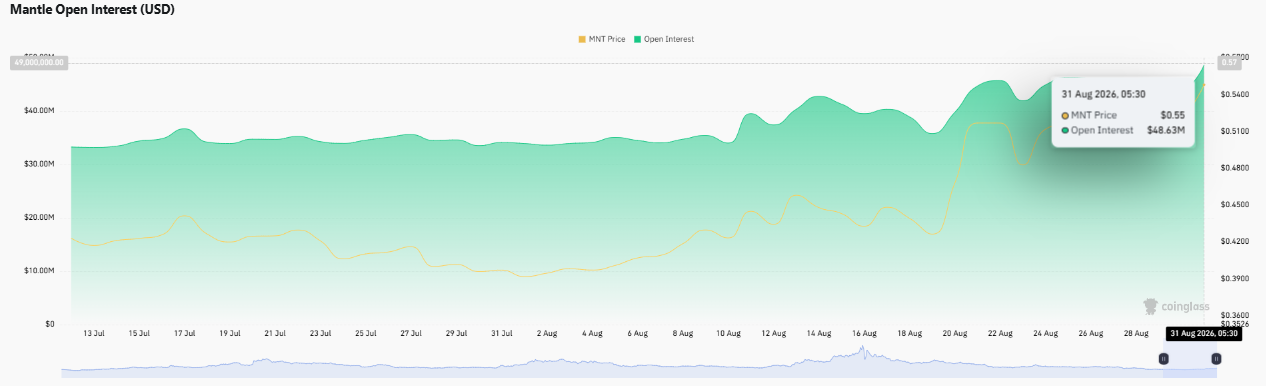
Open interest has climbed to $48.63 million, its highest point in weeks
What Does On-Chain Activity Reveal About Mantle's Network?
Away from price, Mantle's network keeps grinding forward. The chain has now processed close to 294.87 million total transactions, with blocks confirming roughly every 2 seconds, according to Mantlescan data.
Network transaction activity over the past 14 days has held mostly steady in the 50,000-90,000 range, a sign usage hasn't slowed even as the token's price swings around.
What Could Be Next in MNT's Unfolding Price Story?
Before turning to MNT's weekly chart, here is how different Mantle Price Prediction scenarios could play out from here.
Outlook | Trigger | Key Levels |
Bullish | The weekly close confirms above the channel's upper trendline | 0.9266 -> 1.3423 -> 1.6379 |
Neutral | The price holds between 0.5509 and 0.7174 inside the channel | 0.5509 - 0.7174 |
Bearish | Price loses 0.5509 and slips back inside the channel | 0.5509 -> 0.3906 |
Can MNT's Weekly Chart Break Free From Its Descending Channel?
The weekly chart is where this story reaches its turning point. MNT has cleared its earlier resistance at 0.5509, but per the TradingView chart, price is still contained inside a longer descending channel that has rejected every rally since last year's highs.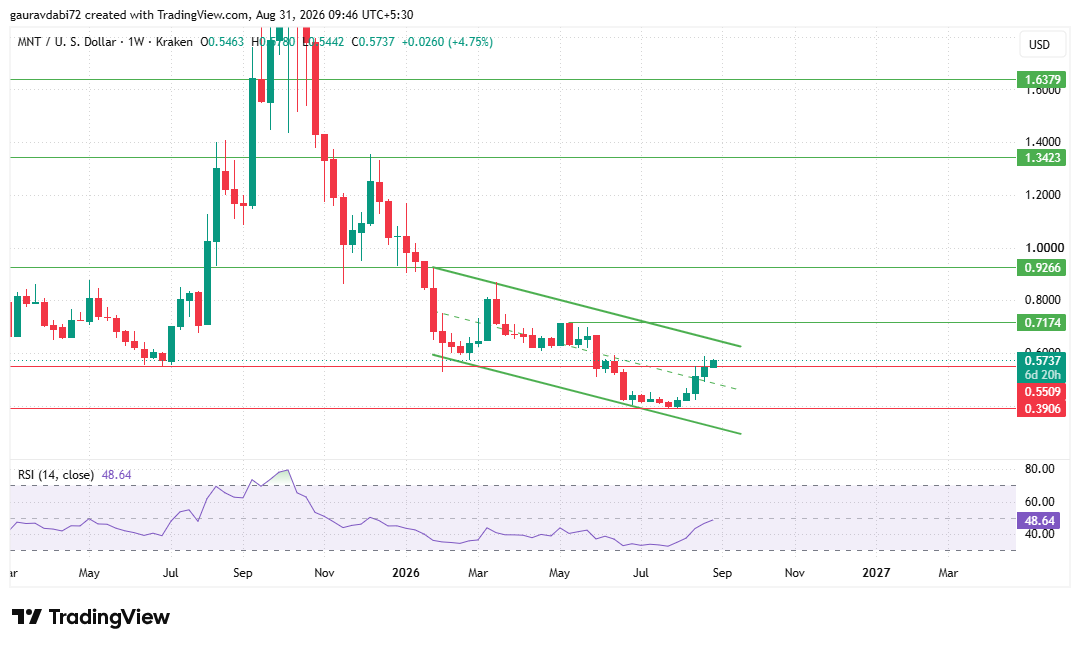
Only a weekly close above the channel's upper trendline would confirm a genuine trend change, opening the path toward 0.9266, then 1.3423, and 1.6379 further out.
Staying inside the channel keeps 0.7174 to 0.5509 as the neutral zone, while losing 0.5509 shifts focus back down to 0.3906.
The weekly RSI reads 48.64, sitting almost exactly at neutral, mirroring a chart that hasn't picked a side yet.
What Does the Analyst Make of This Setup?
As per the CoinGabbar analyst, MNT's reclaim of 0.5509 is a genuinely encouraging subplot, but the bigger story is still the descending channel that has capped every bounce for months.
This Mantle Price Prediction only turns decisive once the price closes a full week above that channel's upper boundary; until then, the token remains a comeback story still searching for its confirmation.
Disclaimer: This article is for informational purposes only and does not constitute financial, investment, or trading advice. Cryptocurrency markets are highly volatile and unpredictable; readers should conduct their own research before making any decisions. CoinGabbar and the author bear no responsibility for losses incurred based on this content.
0
0

 Manage all your crypto, NFT and DeFi from one place
Securely connect the portfolio you’re using to start.


