
Shiba Inu Price Prediction: Shiba Inu Whale Moves 600B Tokens Again

0
0

Shiba Inu price prediction discussions usually start with a quick look at what the token actually is. The Shiba Inu coin launched in August 2020 as an Ethereum-based meme coin, positioning itself early on as a community-driven alternative to Dogecoin.
It has since grown into one of the more widely held meme tokens in the market, currently ranked #33 by market capitalization.
Shiba Inu coin is currently trading at $0.0000053, up 2.5% over the past 24 hours.
That puts Shiba Inu's market capitalization at $3.147 billion, supported by a circulating supply of roughly 589.2 trillion tokens.
Shiba Inu Coin Live Market Data
| Metric | Value |
| Price | $0.0000053 |
| 24h Change | +2.5% |
| 24h Range | $0.0000052 – $0.0000055 |
| Market Cap | $3.147B |
| Fully Diluted Valuation | $3.149B |
| 24h Trading Volume | $74.37M |
| Circulating Supply | 589.239T |
| Total Supply | 589.496T |
Source: SHIB market cap data taken from CoinGecko, data as of Sep 04, 2026. Figures may vary slightly across other tracking websites.
Shiba Inu Exchange Volume
Futures trading activity for SHIB is spread across several mid-sized exchanges rather than concentrated on one venue.
LBank leads with $17.31M in 24-hour futures volume, followed by OKX at $15.89M. 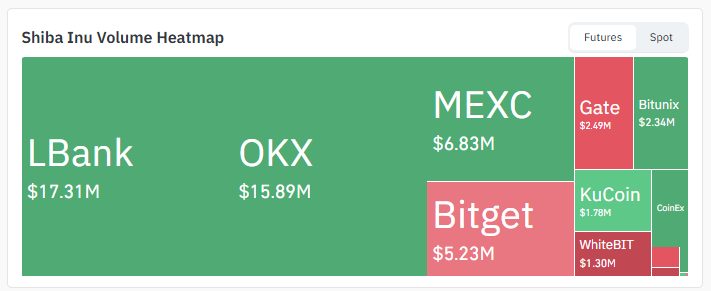
Source: Volume Heatmap Data Taken From CoinGlass, As of Sep 4, 2026
Bitget recorded $5.23M, while MEXC posted $6.83M. Smaller contributions came from Gate at $2.49M, Bitunix at $2.34M, KuCoin at $1.78M, and WhiteBIT at $1.30M, with a limited amount also flowing through CoinEx.
This spread-out volume pattern is typical for meme coins, where retail activity tends to be distributed across a wider set of platforms.
Shiba Inu News
As per U.Today (@Utoday_en): $SHIB The veteran confirms the Shibarium upgrade goes live with 9 contracts verified.
Source: Data Taken From @Utoday_en , X Account, As of Sep 04, 2026
Why it matters: A recognized figure in the Shiba Inu community has confirmed that a new Shibarium upgrade is now live.
The update involves nine verified contracts. Continued development activity on Shibarium is often read as a sign that the ecosystem's underlying technology is still advancing, separate from short-term price swings.
As per BSCN (@BSCNews): Shiba Inu Whale Keeps Unloading a Position Once Worth $9B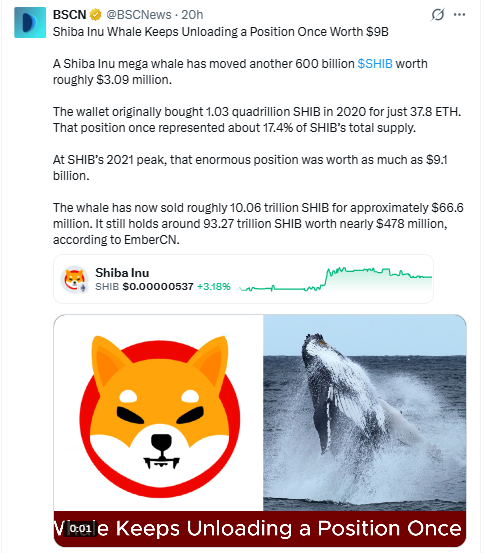
Source: Data Taken From @BSCNews , X Account, As of Sep 04, 2026
Why it matters: A Shiba Inu mega whale has moved another 600 billion SHIB, worth roughly $3.09 million.
The wallet originally bought 1.03 quadrillion SHIB in 2020 for just 37.8 ETH.
That position once represented about 17.4% of SHIB's total supply. At SHIB's 2021 peak, it was worth as much as $9.1 billion.
The whale has now sold roughly 10.06 trillion SHIB for about $66.6 million and still holds around 93.27 trillion SHIB worth nearly $478 million, according to EmberCN.
These two developments pull in different directions. The Shibarium upgrade points to continued ecosystem progress, while the ongoing whale distribution is a reminder that large, early holders still have significant SHIB left to sell.
Shiba Inu Price Prediction Outlook: Technical Analysis
The daily SHIB/USDT chart on Binance shows the price moving inside an ascending channel, with both the upper and lower boundaries sloping upward over the past several weeks.
$SHIB is currently trading close to the middle of that channel, a position that leaves the next move open in either direction.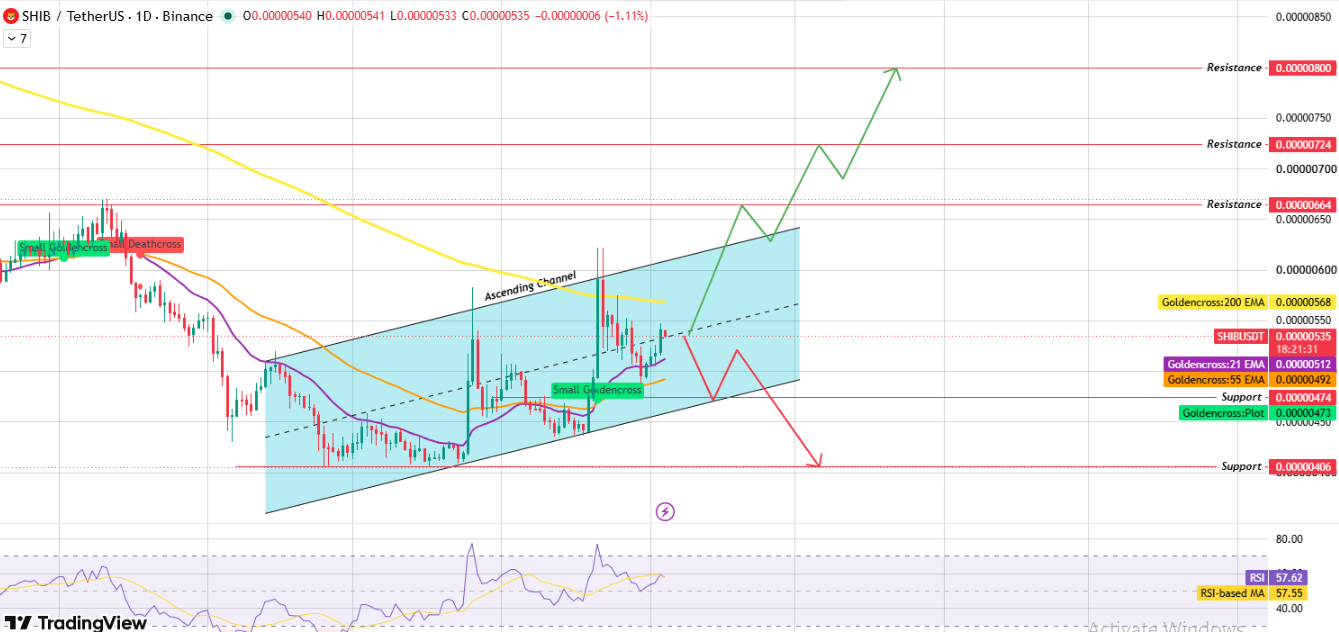
Source: Chart Taken From TradingView , As of Sep 4, 2026
Can SHIB Break Toward the Upper Channel Boundary?
If price bounces from the current mid-channel zone, the first condition for a move higher is a daily close above the 200 EMA at $0.00000568.
Clearing that level along with the channel's upper boundary would open the path toward $0.00000664, then $0.00000724, and eventually $0.00000800.
What Happens If SHIB Breaks the Lower Boundary Instead?
If the price drifts down to the channel's lower boundary and closes below it, the setup shifts bearish.
That would bring the $0.00000474 support into focus first, with a failure to hold there risking a move toward $0.00000406.
The RSI reading of 57.62, with its moving average at 57.55, sits in fairly neutral territory.
This leaves room for a move in either direction without immediate overbought or oversold pressure weighing on the outcome.
Shiba Inu Support and Resistance Levels (Daily Chart)
Level Type | Price |
Resistance 3 | $0.00000800 |
Resistance 2 | $0.00000724 |
Resistance 1 | $0.00000664 |
Support 1 | $0.00000474 |
Support 2 | $0.00000406 |
Shiba Inu EMA Levels (Daily Chart)
| EMA | Value | Price Position |
| 21 EMA | $0.00000512 | Price trading above |
| 55 EMA | $0.00000492 | Price trading above |
| 200 EMA | $0.00000568 | Price trading below |
Shiba Inu Price Prediction: Bull, Base, and Bear Scenarios
| Scenario | Setup | Level |
| Bull Case | Bounce from mid-channel, daily close above the 200 EMA and the channel's upper boundary | $0.0000066, extended level $0.0000072, and $0.0000080 |
| Base Case | Price continues moving between the ascending channel's upper and lower boundaries. | Range-bound trade inside the channel |
| Bear Case | Drop to the channel's lower boundary, followed by a daily close below it. | $0.0000047, deeper breakdown toward $0.0000041 |
Glossary
Ascending Channel: A chart pattern formed by two parallel, upward-sloping trendlines, where price tends to oscillate between the upper and lower boundaries as the broader trend continues higher.
EMA (Exponential Moving Average): A moving average that gives more weight to recent price data, making it react faster to new price action than a simple average.
Golden Cross: A pattern where a shorter-term moving average moves above a longer-term one, often read as an early sign of building upward momentum.
RSI (Relative Strength Index): A momentum indicator scored from 0 to 100 that reflects how fast and how far price has moved recently, commonly used to spot overbought or oversold conditions.
Whale Wallet: A crypto wallet holding an unusually large amount of a given token, large enough that its buying or selling activity can influence market sentiment or, in thinner markets, price itself.
Support Zone: A price area where buying interest has previously been strong enough to slow or reverse a decline.
Resistance Zone: A price area where selling pressure has previously been strong enough to slow or reverse an advance.
Shiba Inu vs Bitcoin
SHIB's price action has largely moved in step with Bitcoin over the past several sessions, consistent with how meme coins typically behave during broader market moves.
Bitcoin price today sits near $81,000, and as the market's dominant asset, its direction tends to set the tone for higher-risk tokens like SHIB.
A steady or rising Bitcoin price prediction environment would likely support SHIB's attempt to clear the upper boundary of its ascending channel.
If Bitcoin turns lower instead, SHIB's mid-channel position could just as easily give way to the downside scenario outlined above, regardless of Shibarium's own development progress.
Expert Opinion
Commentary around the Shiba Inu coin has increasingly split between two threads: steady technical development on Shibarium and persistent selling from some of the token's earliest holders.
Analysts following the meme coin sector note that continued contract verification and upgrade activity suggest the project's technical team remains active, even as large legacy wallets keep trimming their positions.
Near-term price direction is still expected to hinge on whether SHIB can clear its 200 EMA and the upper boundary of the current ascending channel on the daily chart.
Disclaimer: This article is for informational purposes only and does not constitute financial advice. Cryptocurrency markets, including Shiba Inu (SHIB), are highly volatile, and prices can move sharply in either direction within short periods. The bull, base, and bear scenarios outlined above are technical projections based on available chart data and are not guarantees of future performance. There is a realistic possibility that SHIB could fail to reach any of the stated level or could decline well below the support levels discussed, including in the event of broader market downturns or continued large-holder selling. Readers should conduct their own research and consult a qualified financial advisor before making investment decisions.
0
0


 Manage all your crypto, NFT and DeFi from one place
Securely connect the portfolio you’re using to start.


