Crypto Market Price Analysis Today: Bitcoin (BTC), Theta Network (THETA), SSV Network (SSV), HIVE, Popcat
19d ago•

bullish:
0
bearish:
0
Share

Bitcoin struggled to maintain its recovery last week, indicating that bearish sentiment persists as traders use rallies to sell. Bitcoin ended the last week with a loss exceeding 4%. The longer the price remains near $60,000, the higher the chance of a downward breakdown.
Despite this, analysts are bullish on Bitcoin’s price action in the post-halving cycle. Even with the sideways movement, some traditional finance companies are incorporating Bitcoin into their portfolios. JPMorgan Chase and Wells Fargo disclosed exposure to spot Bitcoin exchange-traded funds in their May 10 filing with the United States Securities and Exchange Commission. Although their Bitcoin allocation is small, it represents a positive step. In a recent interview with journalist Mike Solana, Twitter co-founder Jack Dorsey predicted that Bitcoin could surge to at least $1 million by 2030 and potentially go even higher.
Can buyers continue to defend Bitcoin and altcoin support levels, or will the bears take control? Let’s analyze the charts of the top 5 trending cryptocurrencies to find out.
Bitcoin (BTC) Price Analysis
The bulls have successfully defended the $60K level in Bitcoin but have not managed to push the price above the 200-day exponential moving average (EMA) of $63,311. This indicates a strong battle between the bulls and the bears. As of writing, *BTC* price trades at $61,595, surging over 1.5% in the last 24 hours.
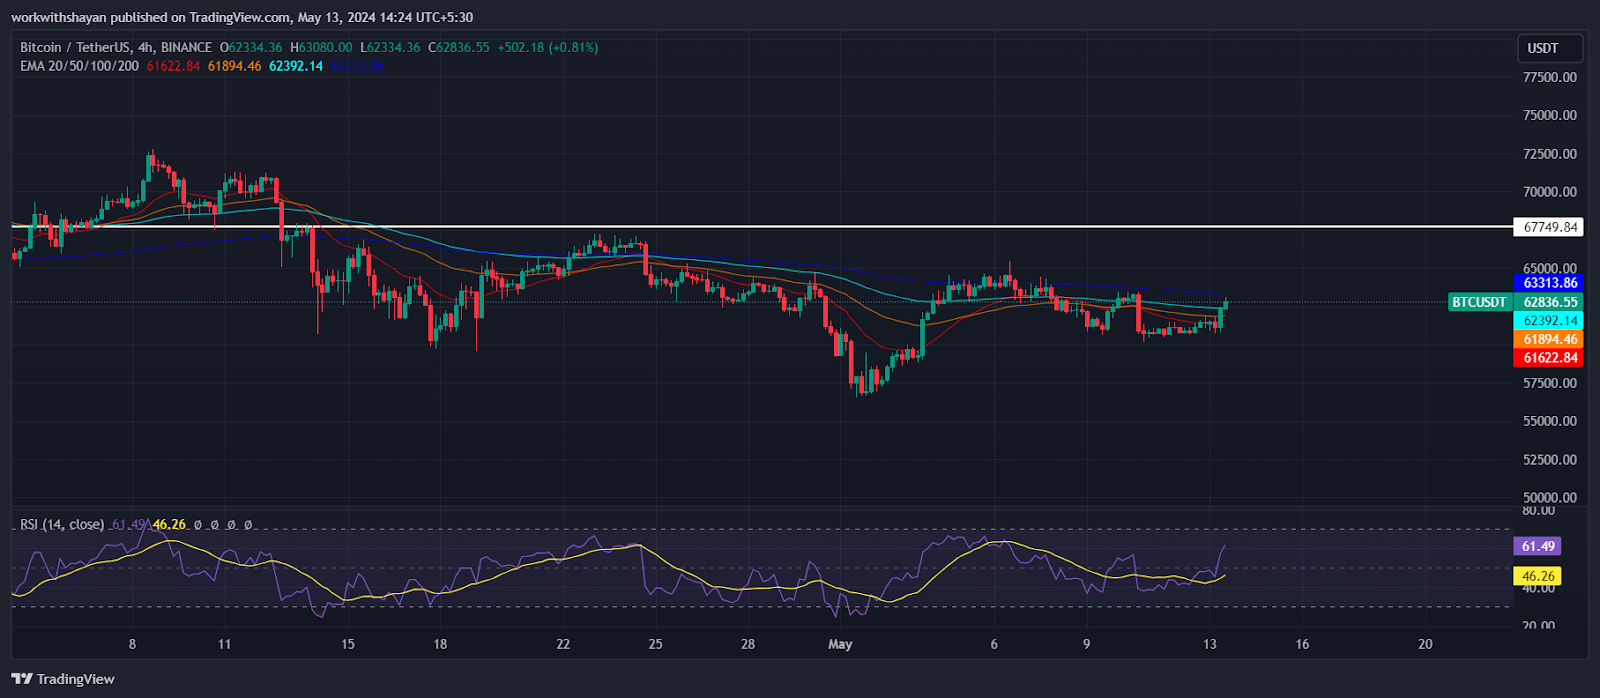
BTC/USDT Chart On TradingView
The declining 20-day EMA and the relative strength index (RSI) in positive territory favor both the sellers and buyers. If the $59,600 level fails to hold, the BTC/USDT pair could retest the May 1 intraday low of $56,552. This level is expected to attract buyers, but if the bears dominate, the pair may drop to the 61.8% Fibonacci retracement level of $54,300.
To prevent further downside, bulls need to send and sustain the price above the 200-day EMA on the 4-hour price chart. If successful, the pair could rise to $67,749. Overcoming this hurdle could initiate a rally to $73,777.
Theta Network (THETA) Price Analysis
Theta price has faced a steep decline as sellers initiated a strong selling pressure around $2.3. As a result, the price broke below several Fib channels and now aims for a retest of the immediate support line. As of writing, Theta price trades at $2, declining over 0.2% in the last 24 hours.
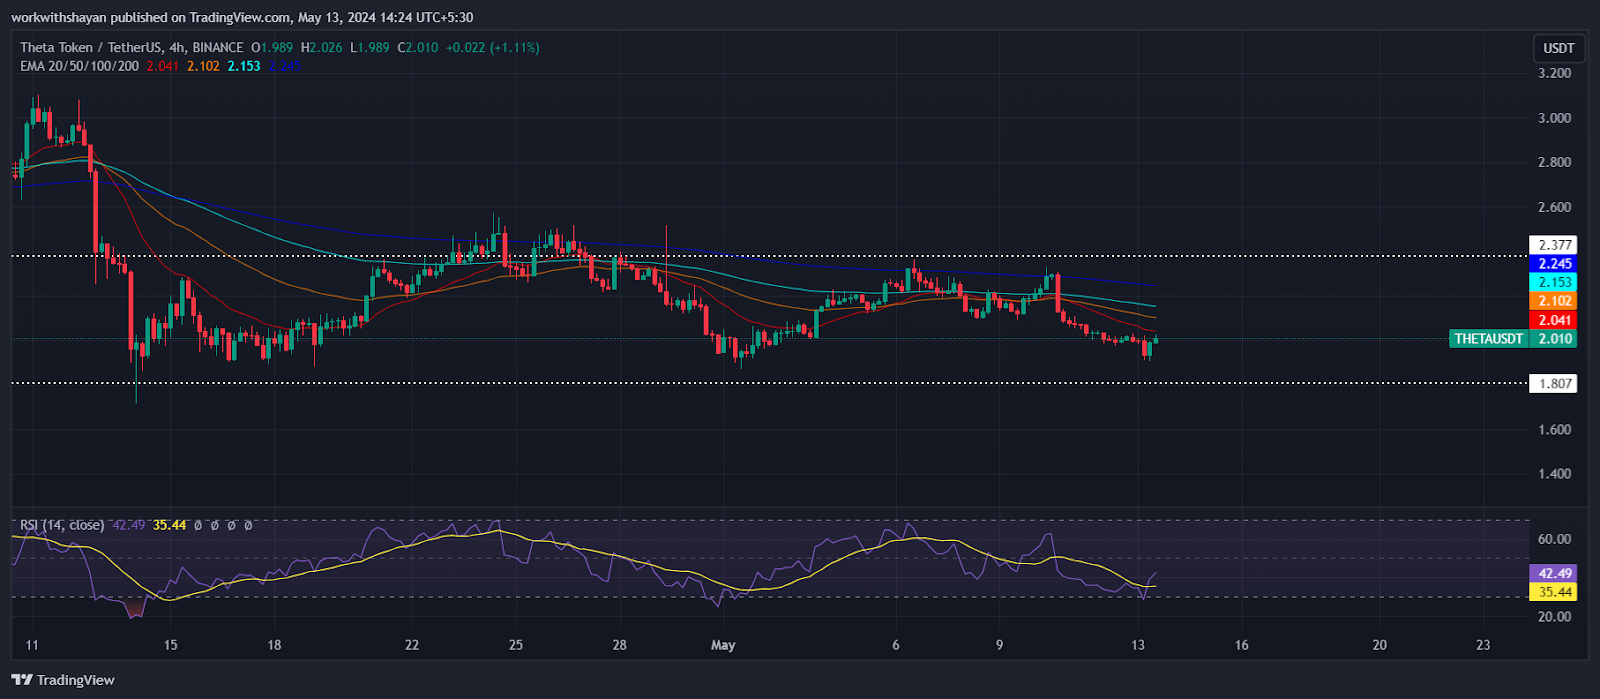
THETA/USDT Chart On TradingView
The downward sloping moving averages and the RSI below the midline favor sellers. A break and close below $1.8 will signal the resumption of the downtrend, potentially pushing the THETA/USDT pair down to the channel’s support line at $1.4.
The area between the 20-day EMA and the resistance line at $2.3 is likely to act as a critical resistance. Buyers will need to push the price above this zone to suggest a potential trend change, which could send the pair to $3.
SSV Network (SSV) Price Analysis
SSV price failed to hold buying demand around the $44 resistance line and dropped below its EMA trend lines quickly. The price is currently consolidating below the EMA20 trend line, aiming to intensify bearish dominance.
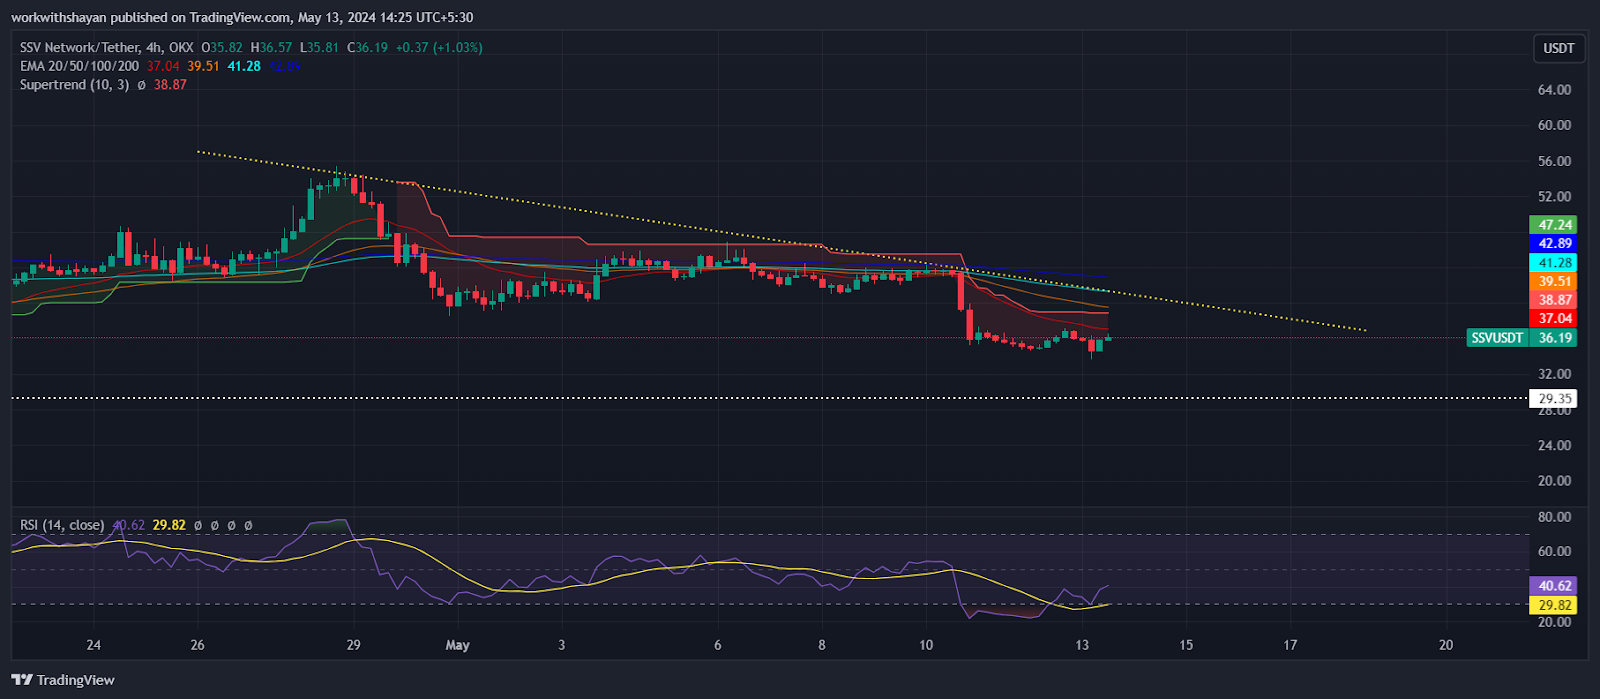
SSV/USDT Chart On TradingView
In a range, traders typically buy at the support level and sell near the resistance. The price movement in between can be unpredictable and volatile. If the price rises above the 20-day EMA ($37), the SSV/USDT pair could reach $44.
Conversely, if the price drops from the 20-day EMA, it indicates that higher levels are still attracting sellers. The pair may fall to the strong support at $29. The next significant move is likely to start above $44 or below $29.
Hive Price Analysis
Hive price is facing a surge in bearish pressure as sellers strongly defended a surge above the $0.37 level. As a result, Hive lost its momentum and dropped to the immediate support of $0.3. As of writing, Hive price trades at $0.32, declining over 9.9% in the last 24 hours.
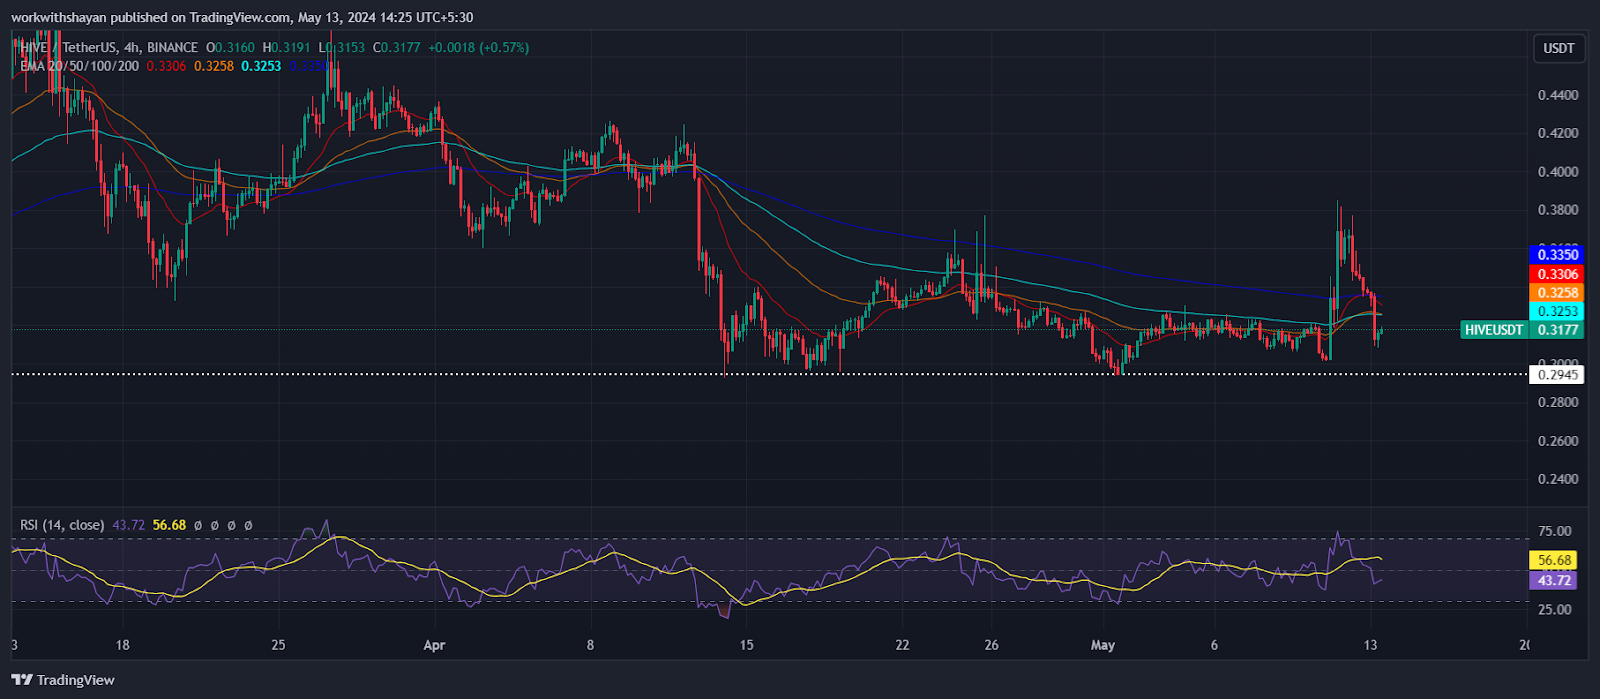
HIVE/USDT Chart On TradingView
The downward slope of the 20-day EMA and the RSI in negative territory suggest that bears have the upper hand. If the price drops below the support line, the HIVE/USDT pair could fall to $0.29.
Conversely, if the price rises above the 20-day EMA, it would indicate a resurgence of bullish sentiment. The pair could then climb to the 50-day SMA ($0.38) and potentially reach the overhead resistance at $0.42, where strong selling pressure from the bears is expected.
Popcat Price Analysis
Popcat price has been on a steady downtrend for over the last few hours as it failed to meet buyers’ demand around $0.58 level. This pushed back the price into the descending channel pattern, currently aiming to validate a clear trend. As of writing, Popcat price trades at $0.405, declining over 5.7% in the last 24 hours.
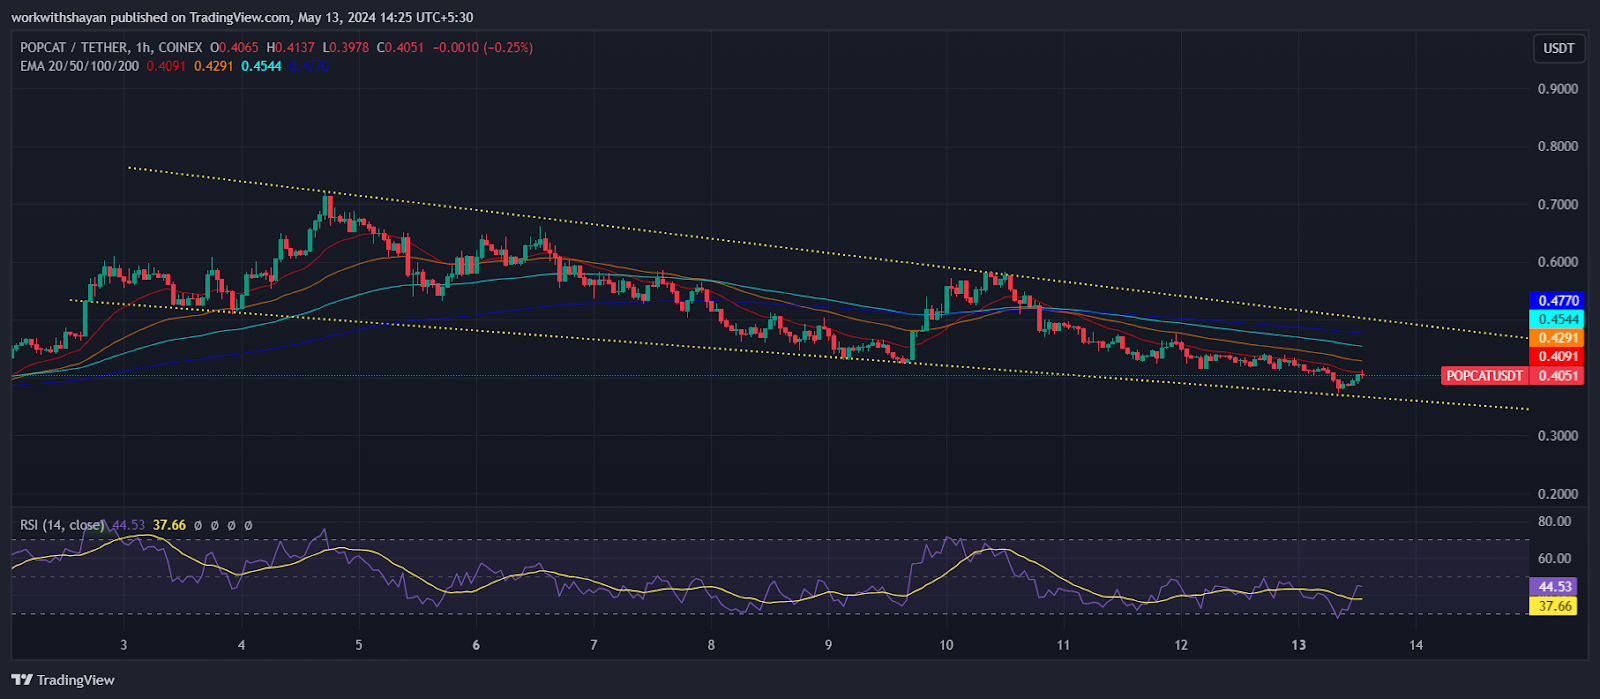
POPCAT/USDT Chart On TradingView
Buyers need to push the price above the 20-day EMA at $0.41 to pave the way for a rally toward the 200-day EMA at $0.47. This is a crucial level for bears to defend, as a break above it could trigger a surge above the channel’s resistance line.
Conversely, if the price drops from the current level or the channel’s support line, the POPCAT/USDT pair may trigger intense selling. The trend could turn bearish if the price falls below $0.3.
19d ago•
bullish:
0
bearish:
0
Share


 Manage all your crypto, NFT and DeFi from one place
Securely connect the portfolio you’re using to start.

bullish:
0
bearish:
0

bullish:
0
bearish:
0


bullish:
0
bearish:
0