Dogecoin at $0.08 in Extreme Fear: all timeframes are bearish

0
0
As of June 18, 2026, the price of Dogecoin is trading around $0.08, pressed against the lower edge of the short-term range. The technical structure on all major timeframes is uniformly bearish, and the market data suggests a weakness that requires caution before taking any position.
Key points
- DOGE is trading at $0.08, below all the main moving averages: EMA20, EMA50 and EMA200
- Daily RSI at 35.46, close to the oversold threshold but without any reversal signal
- Fear & Greed Index at 15 (Extreme Fear) and Bitcoin dominance at 56.17%, a macro context unfavorable to altcoins
- For a credible reversal, a recovery above $0.09 with above-average volumes is needed
The daily chart says it all: unambiguously bearish structure
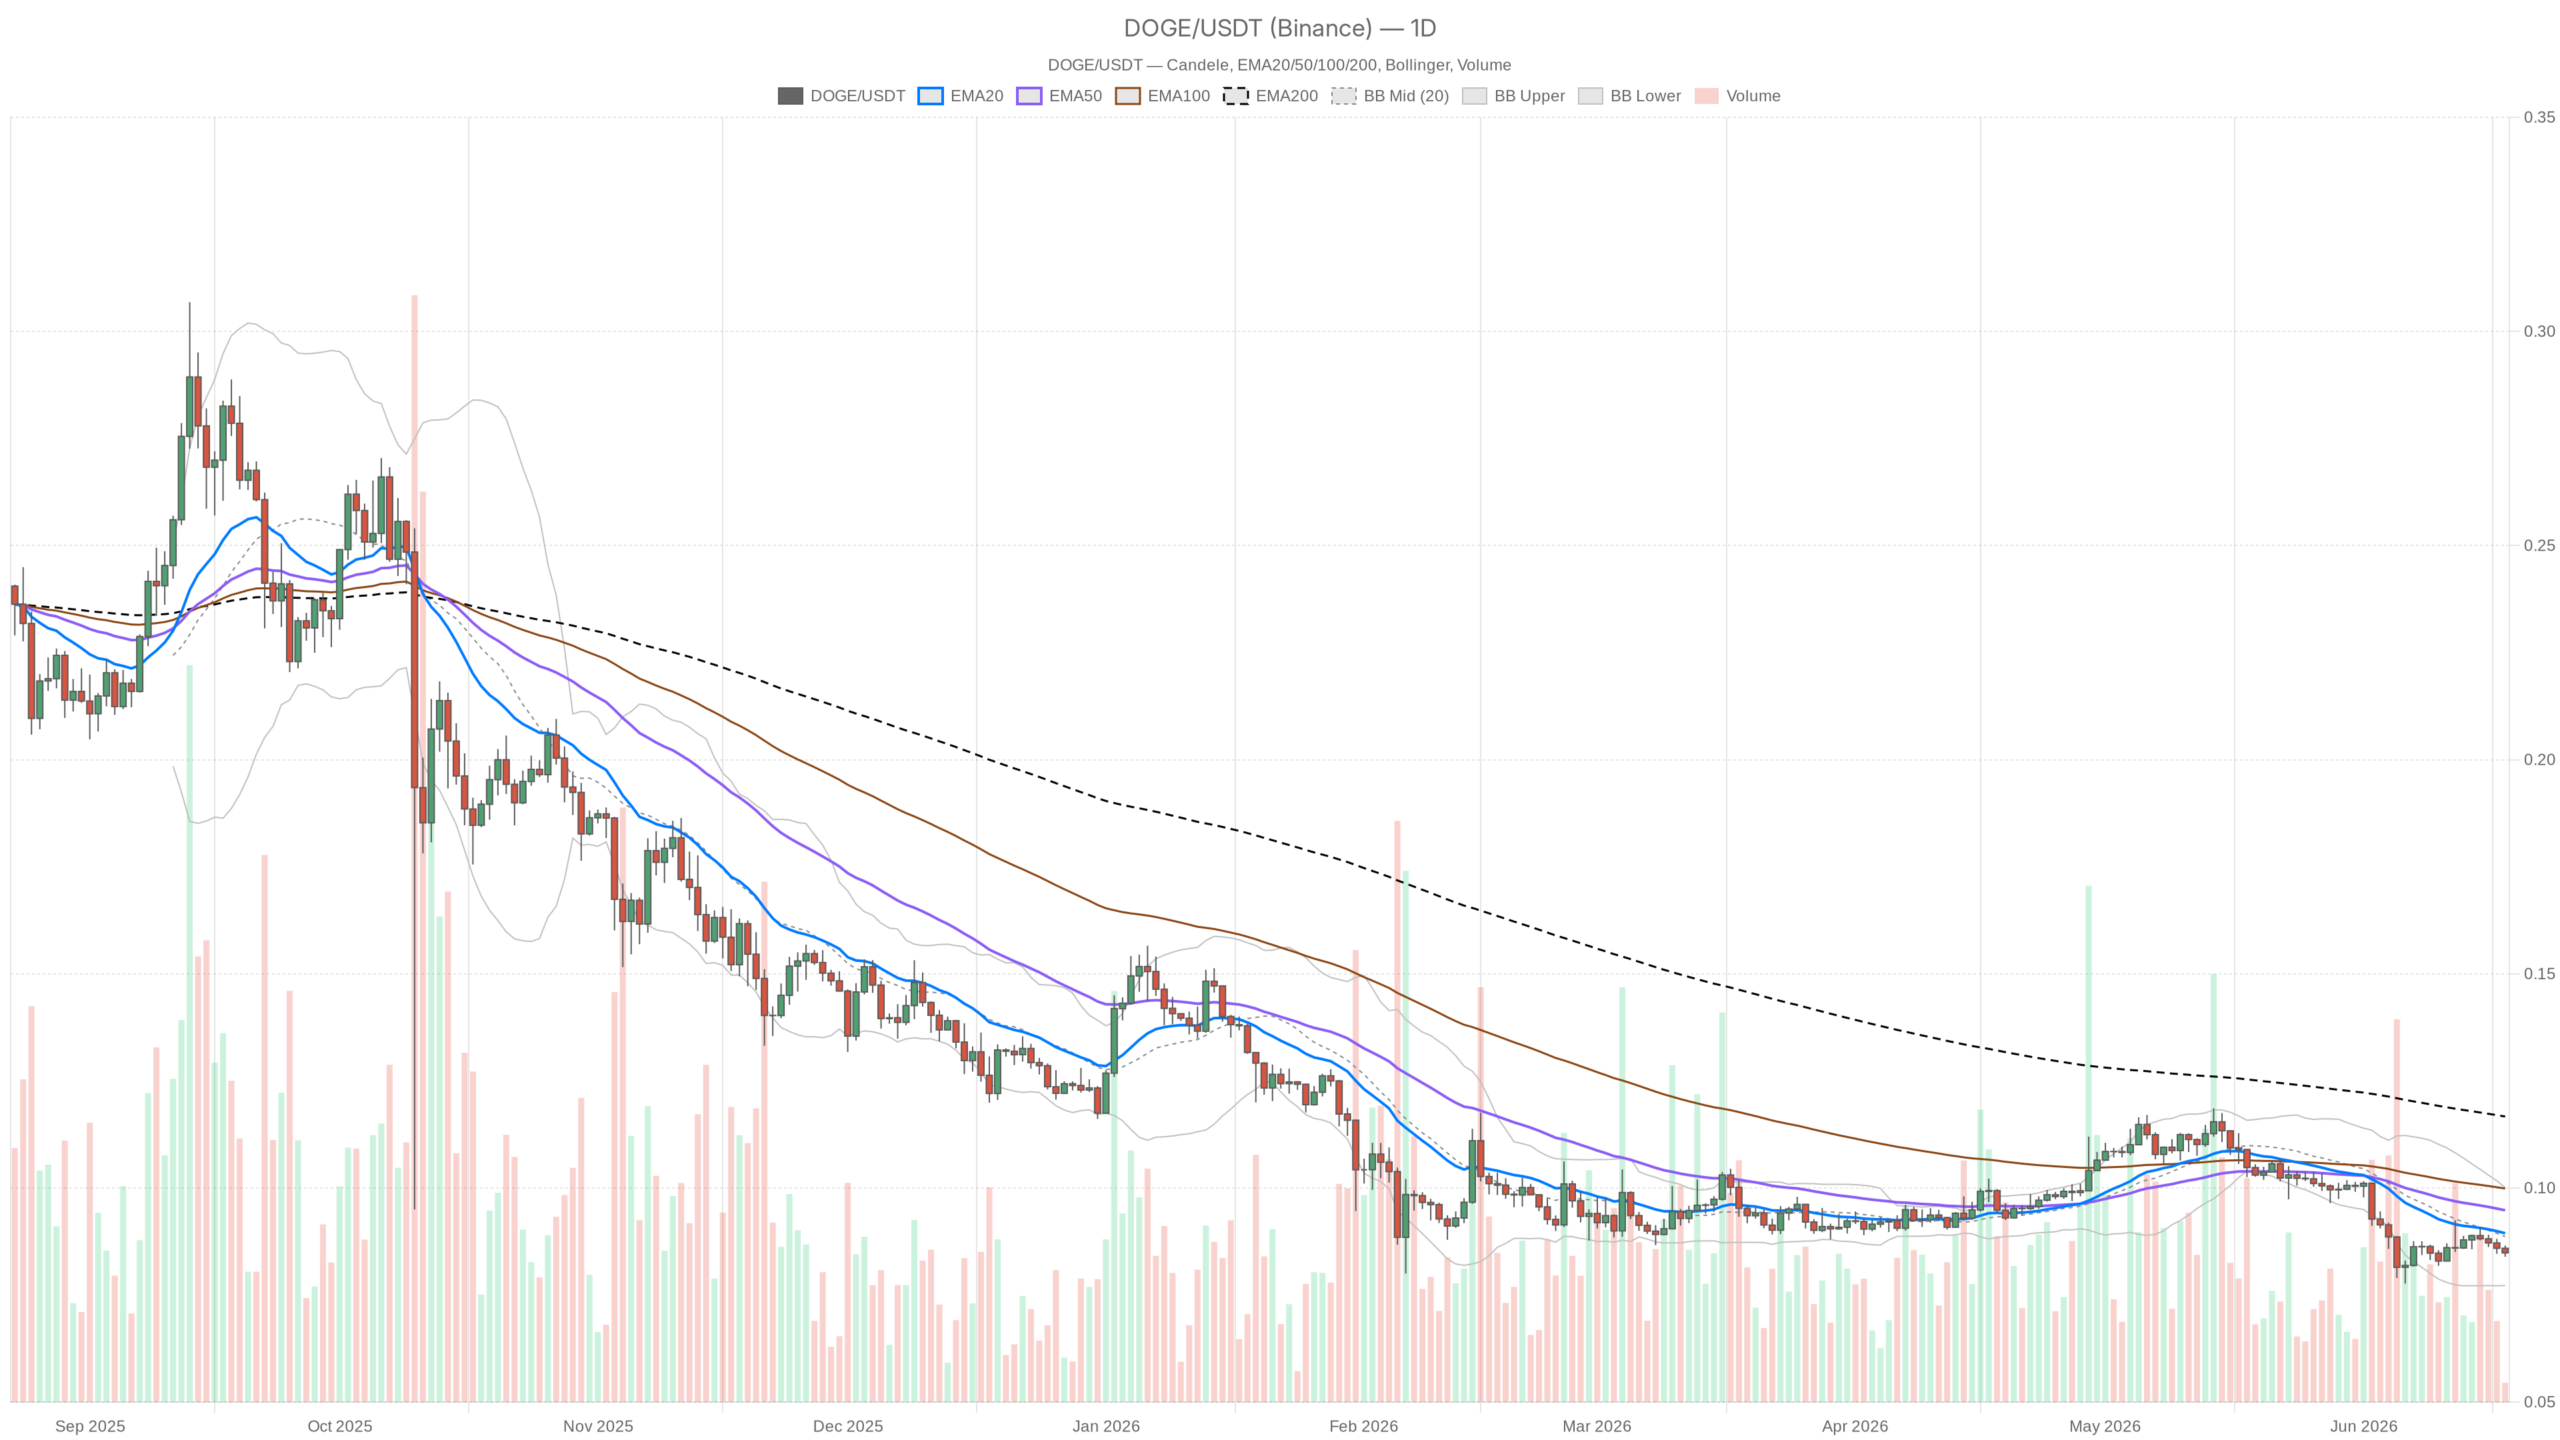
On the daily chart, DOGE is clearly bearish: the price is below all the relevant moving averages. The EMA20 and EMA50 are both positioned around $0.09, while the EMA200 is far away at $0.12, almost 50% above the current price. This configuration leaves no room for interpretation: the long-term trend is bearish and the price is in an area of progressive weakness. The fact that the EMA200 is so far above indicates how much ground DOGE has already lost in previous months.
The momentum on the daily chart confirms this reading. The 14-period RSI is at 35.46, just above the classic oversold threshold at 30. Technically it is not yet oversold, but we are close. Generally, an RSI in this area signals that selling pressure is strong but not yet exhausted. It is not a buy signal: it is a warning that the market is tired of selling, but not necessarily ready to buy.
The Bollinger Bands paint a picture consistent with the rest of the structure. The price is closing exactly on the lower band at $0.08, while the middle band is at $0.09 and the upper band at $0.10. Touching the lower band is not automatically a bullish signal. In the presence of a strong bearish trend, the price can walk along the lower band for weeks. What matters is whether there is a reaction or not.
Hourly timeframe: no divergence, no breathing room
On the hourly timeframe, DOGE does not show any reversal signal: the price at $0.08 remains below all three main EMAs. EMA20, EMA50 and EMA200 are all flattened at $0.09, in a configuration typical of a market that fails to build momentum in either direction, but where gravity pulls downward.
The RSI on H1 is at 39.41, still in a weak area but without signs of extreme capitulation. There is no visible bullish divergence and nothing suggests an imminent reversal in the short term. The hourly pivots show PP, R1 and S1 all compressed around $0.08, indicating an extremely tight price range where directional movement struggles to establish itself.
On the 15-minute chart: some hints of stabilization, but nothing solid
The 15-minute timeframe is the only one showing a slight attempt at stabilization. The RSI at 44.81 is higher than on the higher timeframes, although still below the neutral 50 line. The EMA20 on M15 is aligned with the current price at $0.08, while EMA50 and EMA200 are both at $0.09. This could indicate an attempt at immediate consolidation. However, when framed in the daily and hourly context, it is not enough to speak of a reversal.
In essence, the three timeframes speak the same language, with different shades of intensity. There is no conflict between the readings and no divergence suggesting an imminent breakout to the upside.
The macro context adds pressure
The macro context worsens DOGE’s technical picture: the crypto market’s Fear & Greed Index stands at 15, classified as Extreme Fear. Historically this reading accompanies capitulation phases, but in the absence of concrete catalysts it does not produce automatic rebounds. Bitcoin dominance, according to aggregated market data, is at 56.17%. This means that capital tends to concentrate on the main asset rather than being distributed to altcoins like DOGE. In addition, total market capitalization has fallen by -0.70% over the last 24 hours, with a general context that does not favor bets on highly volatile assets with weak current narratives.
Bullish scenario: possible, but it needs solid confirmations
A credible bullish scenario for DOGE would require a strong recovery above $0.09, a level where EMA20 and EMA50 on the daily chart converge, as well as the middle Bollinger band. A daily close above that threshold, accompanied by an RSI rising towards 45–50, would start to change the technical structure. The next target in a potential recovery would be the $0.10 area, corresponding to the upper daily band, and then, more ambitiously, $0.12 where the EMA200 is located.
This scenario is invalidated if the price fails to break above $0.09 with convincing volumes, or if the bounce fades without an improvement in RSI momentum on the daily chart.
Bearish scenario: the most likely at the moment
The bearish scenario is the most consistent with current data: the structure favors further weakness below $0.08. If the support of the lower Bollinger band does not hold and the price closes a day below this level, there is potentially room down to $0.07 and beyond. The lack of buying volume, the RSI far from the extreme rebound zone and the hostile macro context make this scenario the most likely at the moment.
The bearish scenario would be invalidated only by a rapid and sustained recovery above $0.09 with a confirmed daily close.
How to read this moment
At this stage, DOGE is not building either accumulation or explosive distribution: the price is losing ground slowly and progressively. For those watching Dogecoin during this period, the main risk is so-called knife-catching, that is, buying on a low RSI in the absence of a real reversal signal. The RSI at 35 on the daily may seem attractive, but DOGE has already shown in the past that it can remain in a weak area much longer than expected.
Anyone wanting exposure at this stage would do well to wait at least for a sign of strength on H1, preferably confirmed by a daily close above $0.09 with above-average volume. Before that, caution is not weakness: it is simply the craft of the analyst who respects the data.
FAQ
Is Dogecoin oversold right now?
No, technically it is not. The 14-period RSI on the daily chart is at 35.46, above the classic oversold threshold set at 30. It is an area of marked weakness, but not yet of extreme oversold. In the past, DOGE has shown that it can remain in this area for extended periods without significant rebounds.
What is the key level to watch for a reversal?
The decisive level is $0.09, where EMA20 and EMA50 converge on the daily chart, as well as the middle Bollinger band. A daily close above this threshold, accompanied by an increase in volumes and an RSI rising towards 45–50, would represent the first concrete signal of a possible trend change.
Does the macro context favor a DOGE rebound?
At the moment, no. With the Fear & Greed Index at 15 in Extreme Fear and Bitcoin dominance at 56.17%, capital tends to concentrate on BTC rather than being distributed to altcoins. Total crypto market capitalization is down 0.70% over the last 24 hours, a context that historically penalizes highly volatile assets like DOGE.
{“@context”:”https://schema.org”,”@type”:”FAQPage”,”mainEntity”:[{“@type”:”Question”,”name”:”Is Dogecoin oversold right now?”,”acceptedAnswer”:{“@type”:”Answer”,”text”:”No, technically it is not. The 14-period RSI on the daily chart is at 35.46, above the classic oversold threshold set at 30. It is an area of marked weakness, but not yet of extreme oversold. In the past, DOGE has shown that it can remain in this area for extended periods without significant rebounds.”}},{“@type”:”Question”,”name”:”What is the key level to watch for a reversal?”,”acceptedAnswer”:{“@type”:”Answer”,”text”:”The decisive level is $0.09, where EMA20 and EMA50 converge on the daily chart, as well as the middle Bollinger band. A daily close above this threshold, accompanied by an increase in volumes and an RSI rising towards 45–50, would represent the first concrete signal of a possible trend change.”}},{“@type”:”Question”,”name”:”Does the macro context favor a DOGE rebound?”,”acceptedAnswer”:{“@type”:”Answer”,”text”:”At the moment, no. With the Fear & Greed Index at 15 in Extreme Fear and Bitcoin dominance at 56.17%, capital tends to concentrate on BTC rather than being distributed to altcoins. Total crypto market capitalization is down 0.70% over the last 24 hours, a context that historically penalizes highly volatile assets like DOGE.”}}]}
Disclaimer: This article is for informational purposes only and does not constitute financial advice, investment recommendation or a solicitation to buy or sell financial instruments or cryptocurrencies. The analyses do not guarantee future results. Investments in crypto-assets and financial markets involve a high risk of capital loss. Always do your own research (DYOR) and consult a qualified financial advisor before making any decision.
Content created with the assistance of artificial intelligence and with human editorial review.
0
0

 Manage all your crypto, NFT and DeFi from one place
Securely connect the portfolio you’re using to start.

0
0

0
0

0
0

0
0