
Altcoin Season Indicators Jump as Bitcoin Dominance Stalls: What Changed?

0
0


Altcoins have quietly started outperforming Bitcoin again. BTC dominance has slipped slightly. That’s pointing to a mild but real rotation into higher beta assets.
The Index Behind the Signal
CoinMarketCap’s Altcoin Season Index sits at 64 out of 100 as of September 26.
That’s a sharp climb from where it sat just weeks ago, though still short of the 75 threshold needed for a confirmed altcoin season.
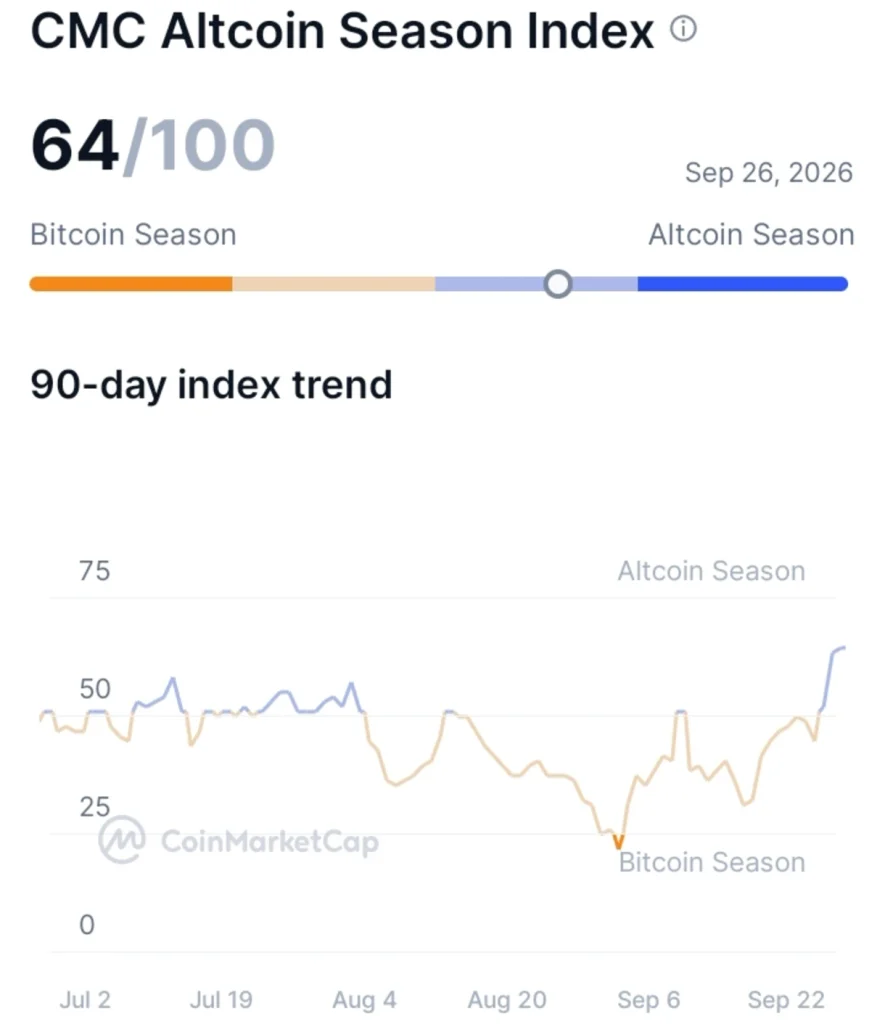
Altcoin market cap is up more than Bitcoin’s over the past week. Majors like XRP, SOL, ADA, and LINK are leading the gains.
A Pattern That’s Shown Up Before
Rotation signals like this have appeared earlier this year too. Seven altcoins posted gains between 12% and 17% in a single week back in March, while Bitcoin traded sideways.
That episode never turned into a full altcoin season. It stayed a targeted rotation instead of a broad market shift. The current setup shares the same early, cautious character.
What’s Driving This Broader Rotation
Bitcoin has stalled near its recent highs. Meanwhile, ETF and regulatory catalysts have broadened out. Ethereum, Solana, XRP, and Zcash have all picked up fresh attention.
DeFi and tokenization themes are drawing capital too. That kind of spreading interest is different from a single coin pumping alone.
Technical Signals Have Flagged This Before
Chart-based signals have pointed to this same shift in the past. One analyst flagged a double-bottom structure, RSI bullish divergence, and a MACD bull cross on altcoin dominance against Bitcoin and Ethereum back in February.
That analyst argued altcoins could outperform without BTC or ETH needing to fall, with all three simply rising at different speeds. The current rotation fits that same framework so far.
Bitcoin’s Weekly Chart Shows Consolidation Near Highs
A TradingView weekly chart created on September 26, 2026, at 11:36 UTC shows BTC/USD at $84,153.73, up 0.14% on the week.
The chart’s high sits at $125,761.31, with the recent low at $38,542.17. Price sits well off both extremes, consolidating inside a tight range for weeks.
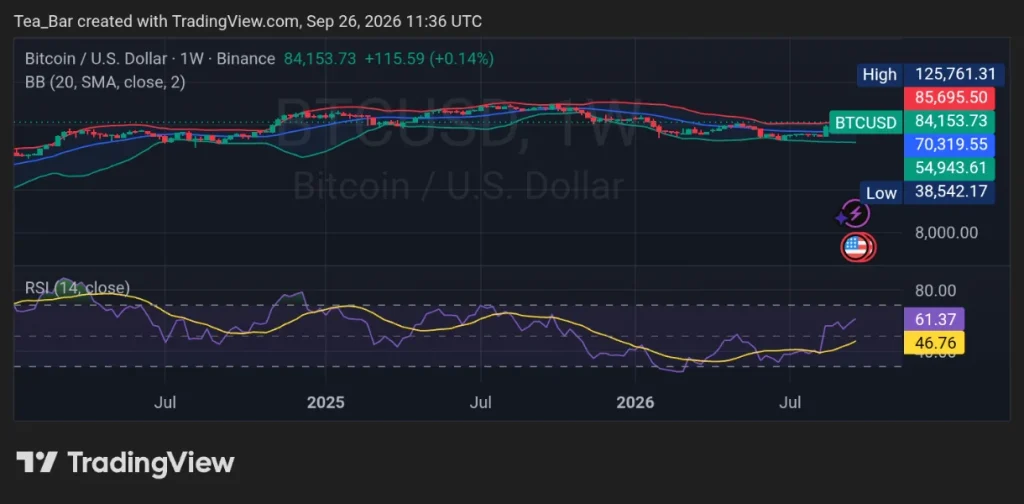
RSI reads 61.37, above its 46.76 moving average, showing steady but unspectacular momentum.
That kind of sideways grind is often exactly when capital starts drifting toward higher beta altcoins instead.
Rotation Can Reverse Just as Fast
Bitcoin dominance rose to 57% back in April as capital pulled back into BTC during a period of macro uncertainty, even as XRP drew separate attention on its own setup.
That history is a reminder that dominance can swing back quickly if Bitcoin breaks out of its current range in either direction.
The Signals Worth Watching From Here
This move still looks early rather than euphoric. The key signals to track are Bitcoin dominance, breadth across altcoins, ETF flows, and leverage or funding rates in derivatives markets.
If those keep confirming what the index is showing now, this rotation has room to keep building.
Disclaimer:
This article is for informational purposes only and does not constitute financial, investment, or trading advice. The views expressed are based on publicly available data, market observations, and the author’s interpretation at the time of writing. Cryptocurrency markets are highly volatile and unpredictable, and past performance or current technical setups do not guarantee future results. Readers should conduct their own research and consult with a qualified financial advisor before making any investment decisions. TechGaged does not accept liability for any losses incurred based on the information presented.
The post Altcoin Season Indicators Jump as Bitcoin Dominance Stalls: What Changed? appeared first on TechGaged.com.
0
0


 Manage all your crypto, NFT and DeFi from one place
Securely connect the portfolio you’re using to start.


