Fibonacci Retracement: A Comprehensive Guide to Understand
2M ago•

bullish:
0
bearish:
0
Share

Various technical analysis tools and indicators are used by crypto traders to predict future price movements. These tools include The Wyckoff Method, The Elliott Wave Theory, Moving Averages, Relative Strength Index, Bollinger Bands, and the Fibonacci Retracement Charts. The Fibonacci retracement tool is unique owing to its roots in the centuries-old Fibonacci sequence. In this guide article, our focus is on Fibonacci Retracement.
Predicting Price Movements: The Role of Fibonacci Retracement
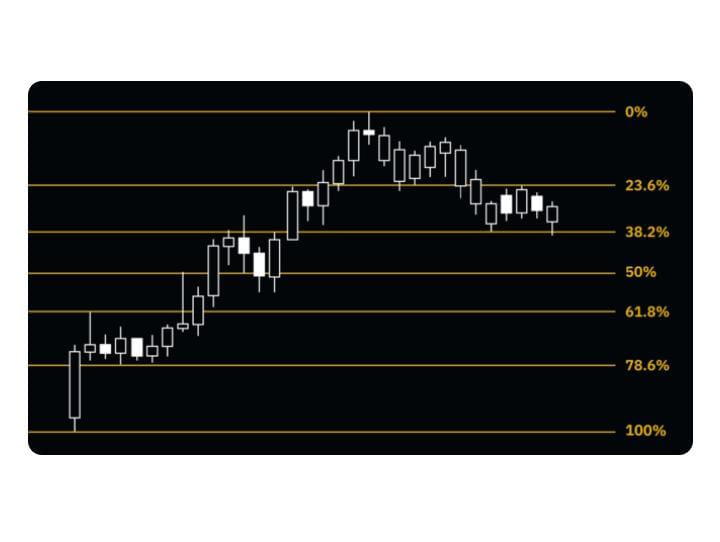
A Fibonacci retracement, or Fib retracement, is a form of technical analysis tool. It is employed by traders to define levels where they anticipate the price action to pause and decline or go up. It is measured by Fibonacci ratios, calculated from the Fibonacci sequence, a series of numbers where each figure is the sum of the other two numerals. Fibonacci transformation areas are up to 0%, 23.6%, 38.2%, 50%, 61.8%, 78.6%, and 100%.
These ratios are drawn on a price table to show trading points where price action may exist, slow down, and save or alter. Traders use Fibonacci retracement to define entrance and exit points and profit goals. They also can use it to prevent loss targets to assist them in making more knowledgeable business choices. Having said that, Fibonacci retracement is not a certain indicator. Moreover, it does not guarantee how price action will or behaves.
Significance of Fibonacci Sequence in Trading
The Fibonacci retracement levels are generated using the Fibonacci sequence. This is a mathematical sequence of numbers where each one is the sum of two numbers preceding it. Traders do not calculate these percentages manually. However, they know how they are generated offers an understanding of their basis in technical analysis.
The sequence commences with zero, followed by one then adds the two numbers to get the third number. This unfolds as follows: 0, 1, 1, 2, 3, 5, 8, 13, 21, 34, 55, 89, 144, 233, 377, 610, 987 and continuing. The sequence of numbers is not directly plotted on the price chart. However, it sets the foundation for Fibonacci retracement levels. Fibonacci retracement levels are calculated from ratios derived from the Fibonacci sequence.
Excluding the beginning numbers, dividing one number by the succeeding yields ratios, which are closely related to specific numbers. For instance, 21 divided by 34 portrays a ratio of nearly 0.618. On the other hand, 21 divided by 55 gives a ratio of about 0.382 and such. In addition to 0.618 and 0.382, there are other Fibonacci retracement ratios which include 0%, 23.6%, 50%, 61.8%, and 78.6%.
These ratios are from calculations derived from the Fibonacci sequence. These provide traders with probable support and resistance levels in a price chart. For instance, the 61.8% retracement level is also known as the “golden ratio.” It is of great interest to traders as it is a key level in Fibonacci analysis. It is estimated an important level indicating a possible reversal point where the price may reverse a major part. Alternatively, the 38.2% retracement level is another significant Fibonacci ratio, and traders closely watch it.
The Fibonacci sequence and the Golden Ratio
The Golden Ratio is based on the Fibonacci sequence, developed by Leonardo Fibonacci in the 13th century. It is generated by adding the two preceding numbers from the starting numbers of 0 and 1. The ratio is expressed as 0.618% or 1.618%. It is derived from the Fibonacci numbers A geometric proportion which is vital in nature, from atomic structures to galaxy-forming, or even the space organization of a honeybee colony. It has long been employed by artists, engineers, and designers to create aesthetically pleasing designs.
The Golden Ratio is found in various art masterpieces such as Mona Lisa and architecture such as pyramids. Meanwhile, the proportion is also associated with financial markets. The Golden Ratio is thought to be involved in market conduct and price fluctuations.
Mastering Support and Resistance with Fibonacci Retracement
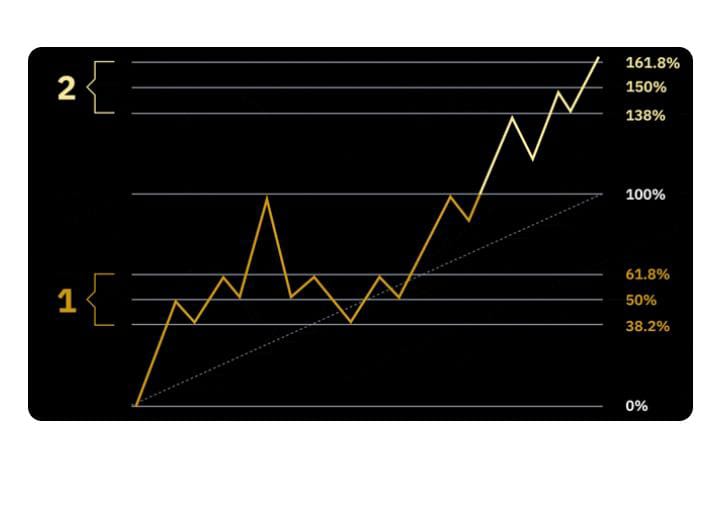
In financial markets, the Fibonacci retracement tool is a useful resource to determine possible support and resistance levels. A trader typically uses the tool by stretching a selection from necessary price points, like lows and highs. Then they measure Fibonacci retracement lines across this period, which reveal possible trend directions. A low point is assigned as 1 in an uptrend or 100%, while a high point is considered as 0 or 0%.
Understanding Fibonacci Levels in Trading
Fibonacci levels, particularly, can be used as entry points, price targets, and stop-loss positions. For example, traders can make money when relying on the price range between different Fibonacci levels. In the case of the uptrend, they can purchase by 38.2% retracement and then sell by 23.6% level. The use of Elliott Wave Theory with Fibonacci levels can strengthen the forecast even more accurately.
Understanding Fibonacci Extension Levels
While Fibonacci levels refer to retracement or bounce zones, which are presented in the animation video above as the number 1. The series also outlines extension levels outside the current range, displayed in the animation as 2. Extension levels include 138.6%, 150%, and 161.8% and are used as trading targets. These trading targets may differ among traders and provide a framework to predict future price development.
Final Thought
In conclusion, Fibonacci Retracement, coming from the Golden Ratio and built on the Fibonacci sequence, is an excellent support for traders. It helps one to identify pivotal support and resistance areas and use this information for trading. Furthermore, it is important to know what Fibonacci levels are. Additionally, traders need to be aware of extension levels to manage risk successfully.
2M ago•
bullish:
0
bearish:
0
Share
 Manage all your crypto, NFT and DeFi from one place
Securely connect the portfolio you’re using to start.

bullish:
0
bearish:
0

bullish:
0
bearish:
0


bullish:
0
bearish:
0