
Why Is LINK Falling Today? Chainlink Price Prediction Breaks It Down

0
0

Chainlink price prediction is back in focus as LINK finds itself pressed right up against a trendline that has rejected it before, all while a large wallet just made a move that has traders asking questions.
The chart is at a decision point, and the answer could come fast on this timeframe. Here is the full picture.
Chainlink Price Today: Live Data and 24-Hour Change
LINK is currently trading around $11.845, down 4.91% over the past 24 hours after losing about $0.61 from its prior level.
Futures volume over the last day sits at $653.25 million, well ahead of spot volume at $150.41 million, showing leveraged traders are driving most of the current activity.
Open interest stands at $665.06 million against a market cap of $8.85 billion. Circulating supply sits at 748.09 million LINK out of a fixed total and max supply of 1 billion tokens, meaning the vast majority of LINK's eventual supply is already in circulation.
Source: CoinGlass, September 10, 2026.
Chainlink News: Whale Sends $26M to Coinbase
In Chainlink latest news, BSCN flagged a report from OnchainLens showing that an unknown whale has sent more than $26 million worth of LINK to the Coinbase exchange. 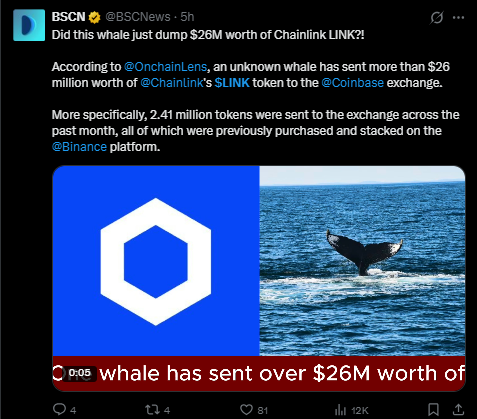
Specifically, 2.41 million tokens moved across the past month, and all of it had been previously purchased and held on Binance before being routed to Coinbase.
Large transfers to exchanges like this often get read as a precursor to selling, since coins typically move to an exchange when a holder wants liquidity, but it is worth noting that a transfer alone does not confirm a sale has happened or will happen.
Still, for anyone tracking Chainlink trend analysis, a move of this size from a single wallet is the kind of signal that tends to keep both bulls and bears on edge until the next few candles clarify things.
Source: BSCN (@BSCNews) on X, citing OnchainLens data.
Quick Take
CMP: $11.846 (chart-marked live price)
1-hour trigger level: break and close above $12.795 shifts momentum back in favor of buyers
Failure level: break and close below $11.500 opens the door to deeper downside
Data and chart timestamp: September 10, 2026, 1-hour Binance perpetual chart
Risk note: LINK is sitting right on top of trendline resistance, so this could resolve quickly in either direction once a confirmed 1-hour close prints
Chainlink Technical Forecast September 2026
On the 1-hour Binance perpetual chart, LINK has been sliding down a descending trendline that connects its recent swing high near $13.654 to a lower high formed a few days later, and price has now worked its way back up to test that same trendline from below. 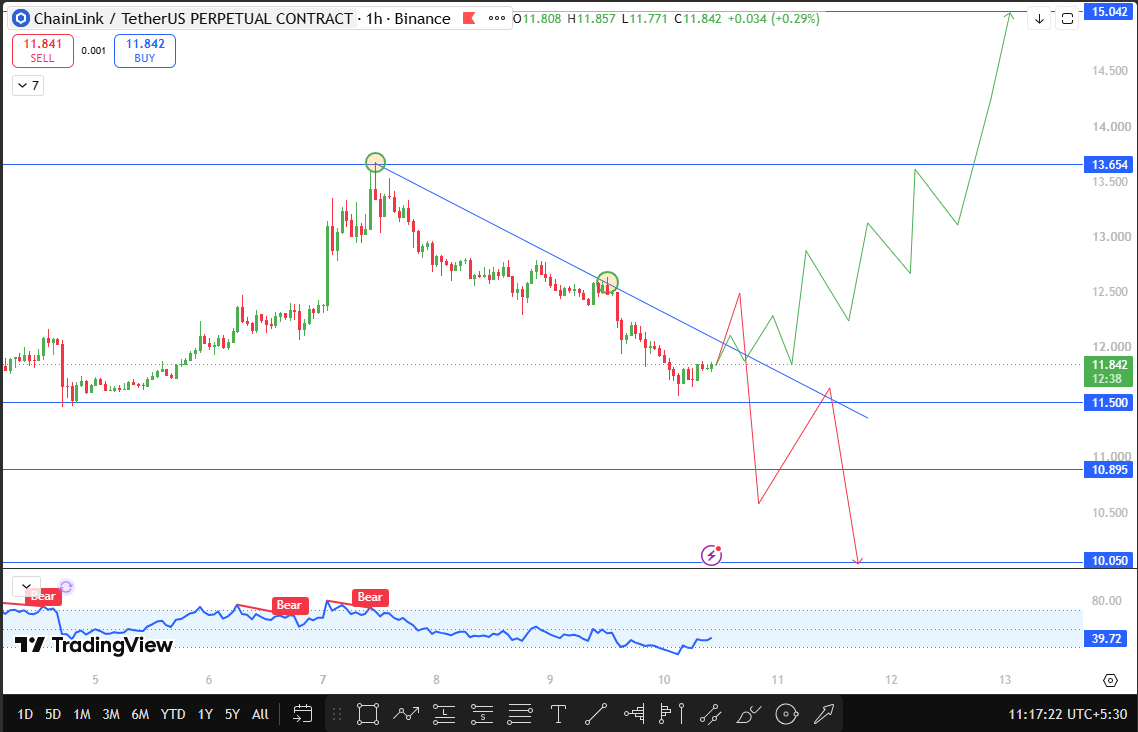
This is the second time LINK has approached this exact line, and how it behaves here matters a lot for the near-term Chainlink price outlook.
If LINK manages to break and close above the trendline while holding above $12.795, that would be a meaningful shift in structure, roughly 8% above the current price.
A confirmed move through that zone would put the old swing high at $13.654 back in play, about 15.3% higher than where LINK sits right now.
If buyers stay in control beyond that point, the next major resistance target lines up at $15.042, close to 27% above current levels, though a move that far would likely need sustained volume and probably some help from the broader market rather than LINK acting entirely on its own.
On the downside, this is where the whale transfer to Coinbase becomes relevant for anyone doing LINK technical analysis.
If the trendline rejection holds instead and LINK closes below $11.500 on the 1-hour chart, that is only about 2.9% below the current price, which means this level is close enough to get tested quickly if selling pressure builds.
A break there would likely send price toward $10.895 next, roughly 8% below current levels, and if that fails to hold as well, the deeper support at $10.050 comes into view, about 15% under where LINK trades today.
That $26 million worth of $LINK is now sitting on Coinbase adds a layer of caution to this downside scenario, since exchange balances can turn into real sell pressure with very little warning.
Right now, $LINK is essentially at a coin flip on the chart, trendline resistance overhead, a large wallet's exchange deposit hanging over sentiment, and a fairly tight range between the trigger levels on both sides.
Chart Source: TradingView, LINK/USDT Perpetual Contract, Binance, 1-hour timeframe, September 10, 2026.
Support and Resistance Levels
Type | Level | % From CMP |
Resistance 2 | $15.042 | +26.98% |
Resistance 1 | $13.654 | +15.26% |
Near-term hurdle | $12.795 | +8.01% |
Current Price | $11.846 | -- |
Support 1 | $11.500 | -2.92% |
Support 2 | $10.895 | -8.03% |
Support 3 | $10.050 | -15.16% |
Bull, Base, and Bear Case
In the bull case, $LINK finally breaks through the descending trendline, closes above $12.795, and works its way back toward the old swing high at $13.654, with $15.042 becoming the stretch target if momentum carries further.
The base case has $LINK continuing to chop right at the trendline without a decisive close either way, staying stuck between $11.500 and $12.795 while the market waits for either the whale's next move or a broader catalyst to force a direction.
The bear case plays out if the trendline rejection holds and LINK closes below $11.500. In that scenario, the Coinbase deposit becomes more concerning, and a slide toward $10.895, then possibly $10.050, would become the more likely path.
Risks to This Outlook
An exchange deposit does not automatically mean a sale is coming; whales sometimes move funds for reasons unrelated to selling, including internal transfers, OTC arrangements, or repositioning across venues.
Broader market conditions, Bitcoin's own trend, and sudden liquidity shifts in the futures market could all move LINK independently of this specific technical setup, so these levels should be read as a framework rather than a guarantee.
Glossary
Descending trendline: a falling resistance line connecting a series of lower highs, used to judge whether sellers are consistently capping price at progressively lower levels.
Exchange inflow: tokens moved from a private or cold wallet onto a trading exchange, often watched as an early signal of potential selling intent.
Open interest: the total value of outstanding futures and perpetual contracts that remain unsettled, often used as a gauge of active leveraged positioning.
1-hour close: the final traded price at the end of a 1-hour candle, used here as the confirmation trigger for breakout or breakdown scenarios.
Disclaimer
This article is for informational purposes only and does not constitute financial advice. Cryptocurrency markets are highly volatile, and price predictions are based on technical analysis of historical chart patterns, which do not guarantee future outcomes. Readers should conduct their own research and consult a qualified financial advisor before making any investment decisions.
0
0

 Manage all your crypto, NFT and DeFi from one place
Securely connect the portfolio you’re using to start.


