Daily Market Review: BTC, ETH, FLOKI, W, RUNE

0
0

Bulls have taken control of the markets, as seen from the increase in the global market cap. The total cap stood at $2.31 as of press time, representing a 2.29% increase over the last 24 hours. On the other hand, the trading volume increased by 9% to stand at $73.5B in the same period.
Bitcoin Price Review
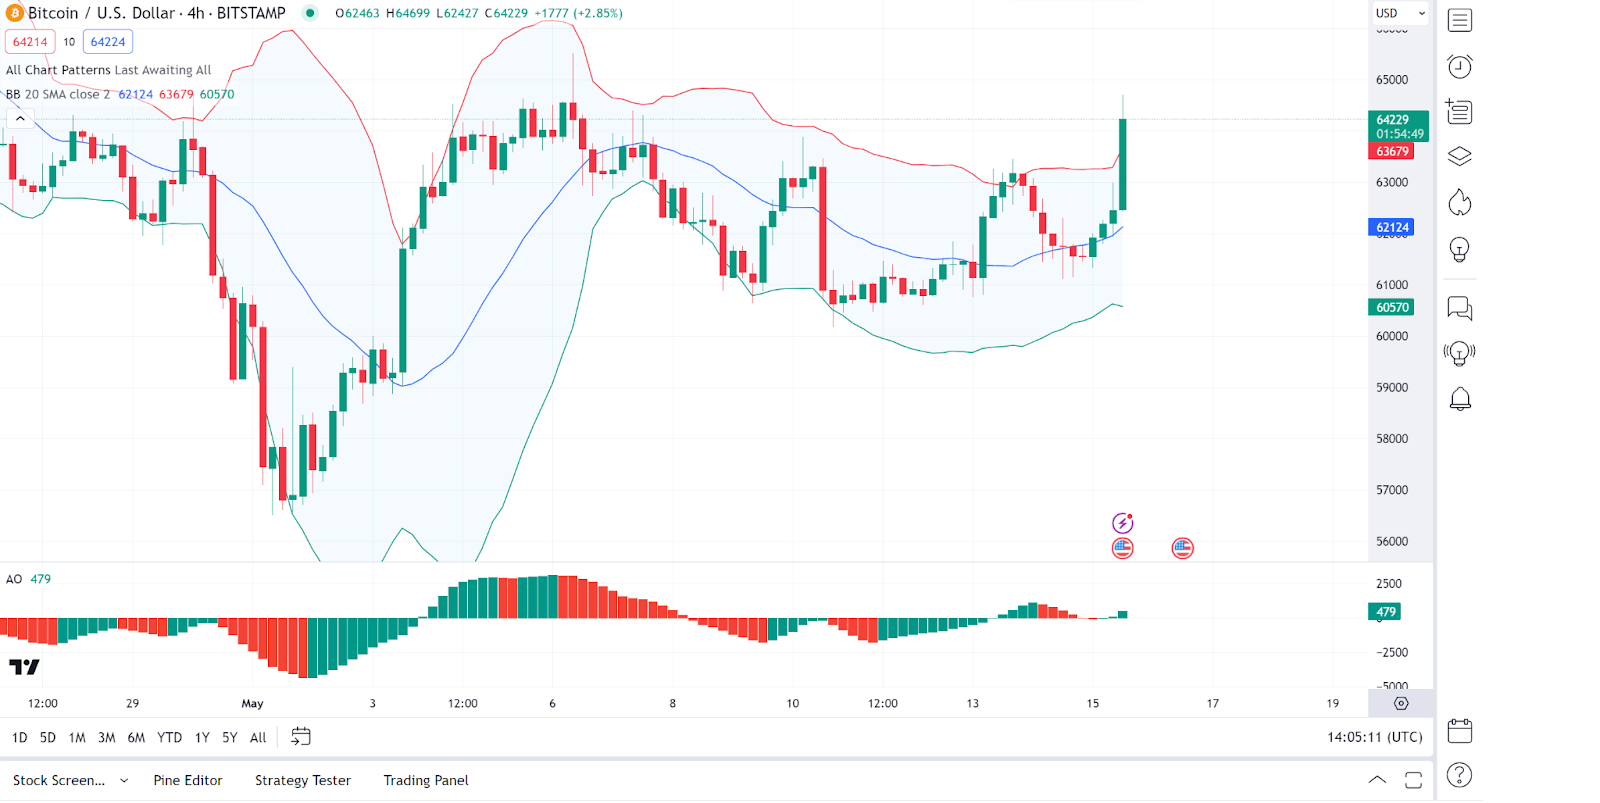
Bitcoin (BTC) is now in an uptrend, as evidenced by its price movements. An in-depth analysis shows that the Bitcoin price is currently testing the upper Bollinger Band, indicating potential overbought conditions. A breakout above the upper band suggests a continuation of the bullish trend.
On the other hand, the Awesome Oscillator (AO)is positive and increasing, reflecting bullish momentum. The green bars indicate that the bullish momentum is gaining strength. As of press time, the Bitcoin price stood at $64,197, a 4.6% increase from its previous 24-hour price.
Ethereum Price Review
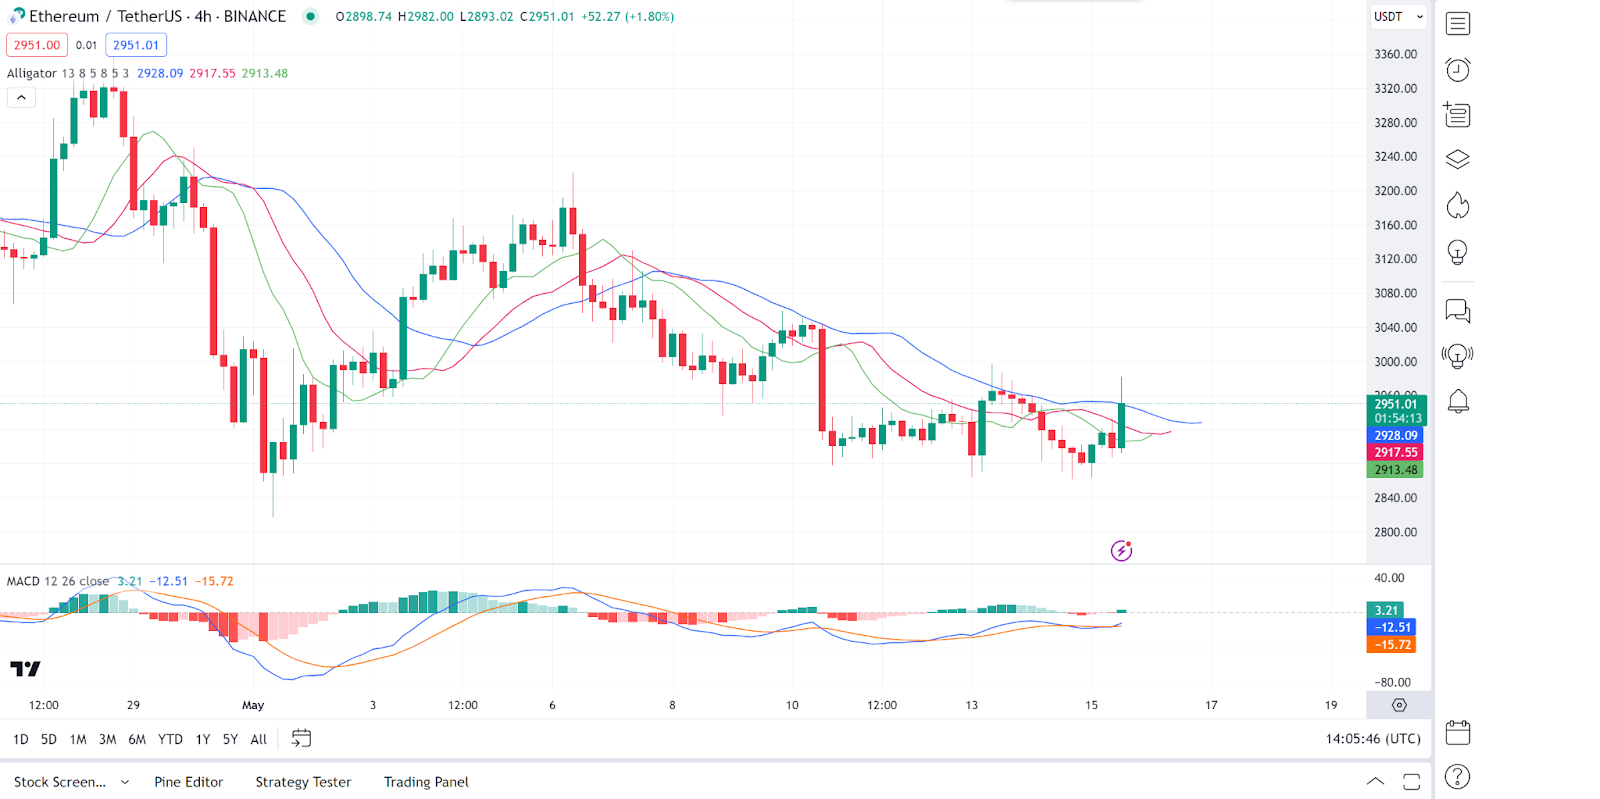
Ethereum (ETH) is another gainer in today’s session as bulls generally awaken. An in-depth analysis shows that The Alligator lines (lips, teeth, and jaw) are in a converging phase, suggesting a potential trend change or consolidation. A recent bullish crossover indicates a potential upward movement.
On the other hand, the MACD line is slightly below the signal line, indicating a potential bullish crossover. The histogram shows decreasing bearish momentum. As of press time, the Ethereum price stood at $2,953, a 2.3% increase from its previous 24-hour price.
Floki Price Review
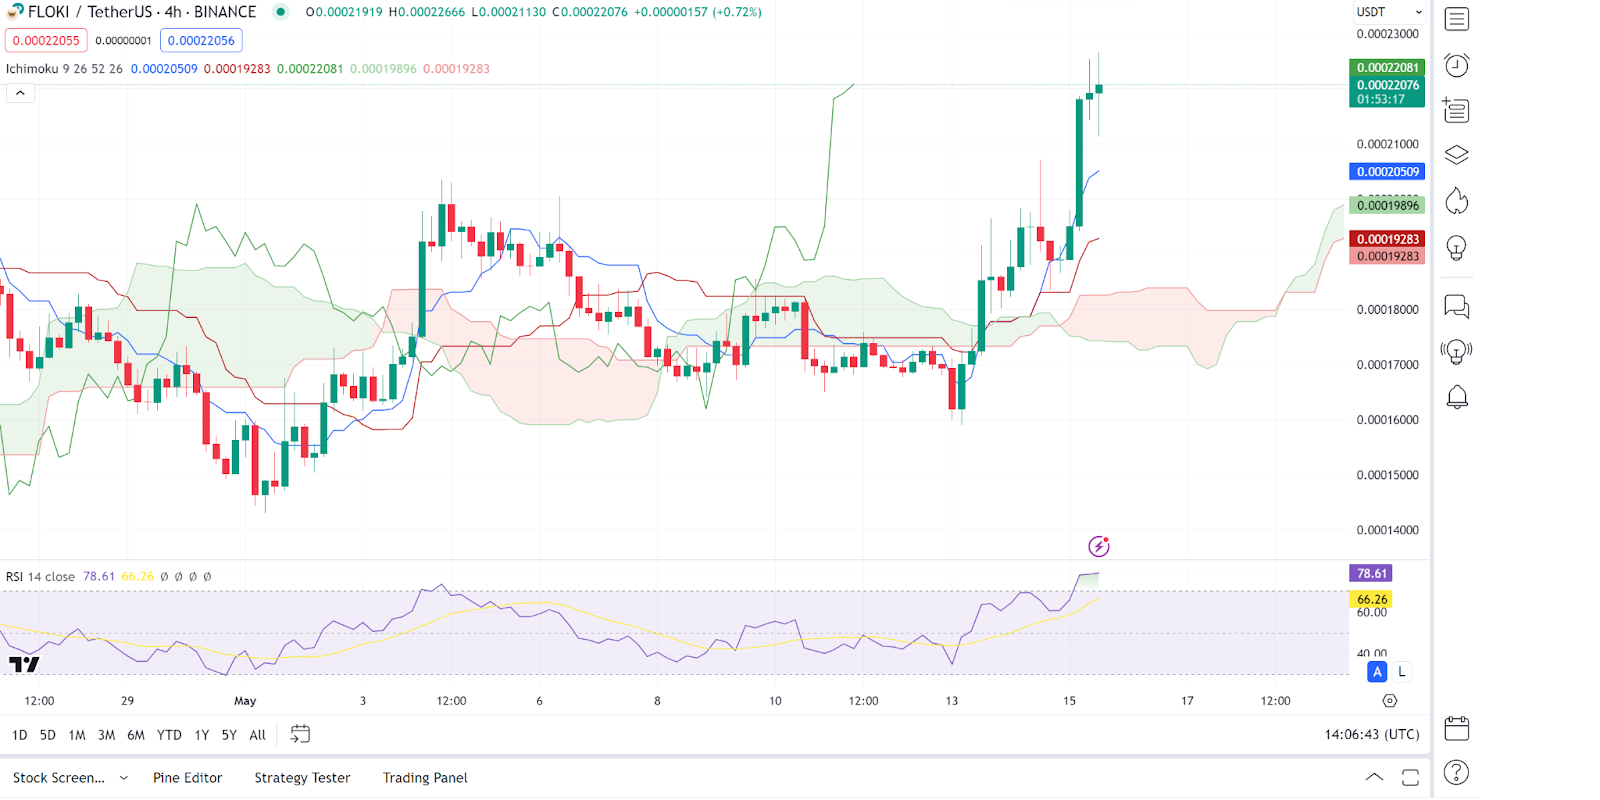
Floki (FLOKI) is another gainer in today’s session, as seen from its price movements. Analysing Floki price charts, we see that the Floki price is above the cloud, indicating a bullish trend.
The leading span lines are widening, suggesting strong bullish momentum.
On the other hand, the RSI is at 78.61, indicating overbought conditions. Due to this, a potential pullback or consolidation may occur. As of press time, the Floki price stood at $0.0002211, a 12.3% increase from its previous 24-hour price.
Wormhole Price Review
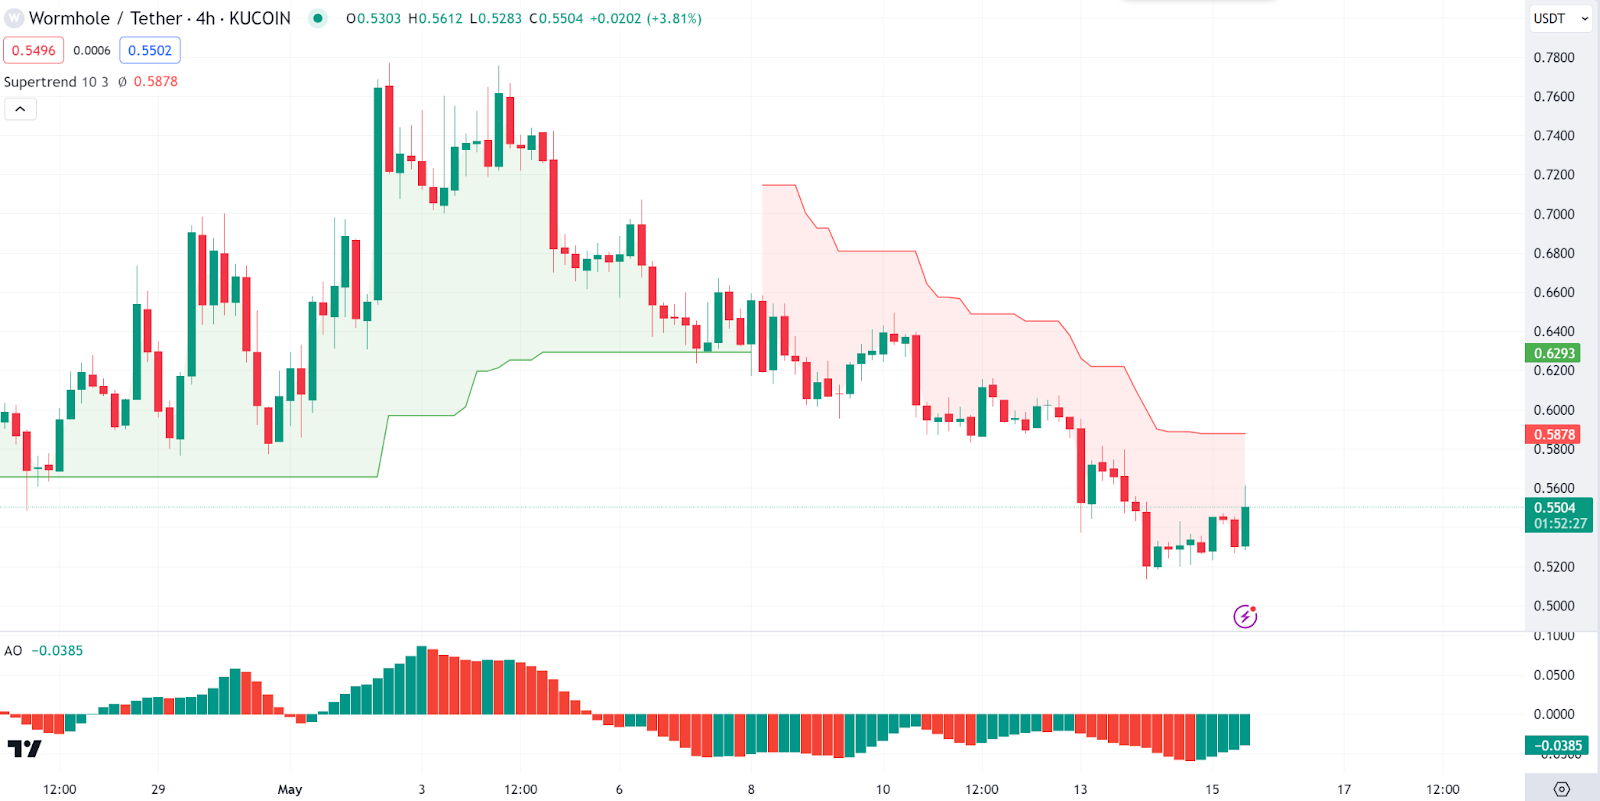
Wormhole (W) is among the top gainers today, as evidenced by its price movements. An in-depth analysis shows that the Supertrend is showing a bearish signal with the price below the red line. A break above the Supertrend line at $0.5878 would indicate a potential reversal to a bullish trend.
On the other hand, the Awesome Oscillator (AO) is slightly negative, suggesting bearish momentum. However, the histogram shows reduced bearish pressure, indicating potential consolidation. As of press time, the Wormhole price stood at $0.5518, a 5.56% increase from its previous 24-hour price.
THORChain Price Review
THORChain (RUNE) is also another gainer in today’s session, as its price movements show. Analysing THORChain price charts, we see that the THORChain price has recently bounced off the lower boundary of the pitchfork channel. The upward movement within the pitchfork indicates potential bullish continuation.
On the other hand, the Money Flow Index (MFI) is at 60.96, indicating moderate buying pressure. The recent increase in MFI suggests accumulation by buyers. As of press time, the THORChain price stood at $5.88, a 7.6% increase from its previous 24-hour price.

0
0

 Manage all your crypto, NFT and DeFi from one place
Securely connect the portfolio you’re using to start.