Daily Market Review: BTC, ETH, LDO, GNO, OP
5d ago•

bullish:
0
bearish:
0
Share

Today’s market session has seen bears on the front foot as seen from the drop in the global market cap. The total cap stood at $2.44T as of press time representing a 0.39% decrease over the last 24 hours, while the trading volume on the other hand stood at $69.8B, representing a 24% decrease over the last 24 hours.
Bitcoin Price Review
Bitcoin (BTC) is having a bear session today as seen from its price movements. Looking at an in-depth analysis, we see that Bitcoin is currently trading below its 20 SMA, with the Bollinger Bands expanding, suggesting increased volatility. Recent price action has seen a decline below the midline of the bands, indicating bearish momentum.
On the other hand, we see that the Woodies CCI shows a trend reversal, moving from positive to negative territory, which could imply a shift to bearish sentiment in the market. As of press time, the Bitcoin price stood at $66,190, representing a 1.2% drop from its previous 24-hour price.

Ethereum Price Review
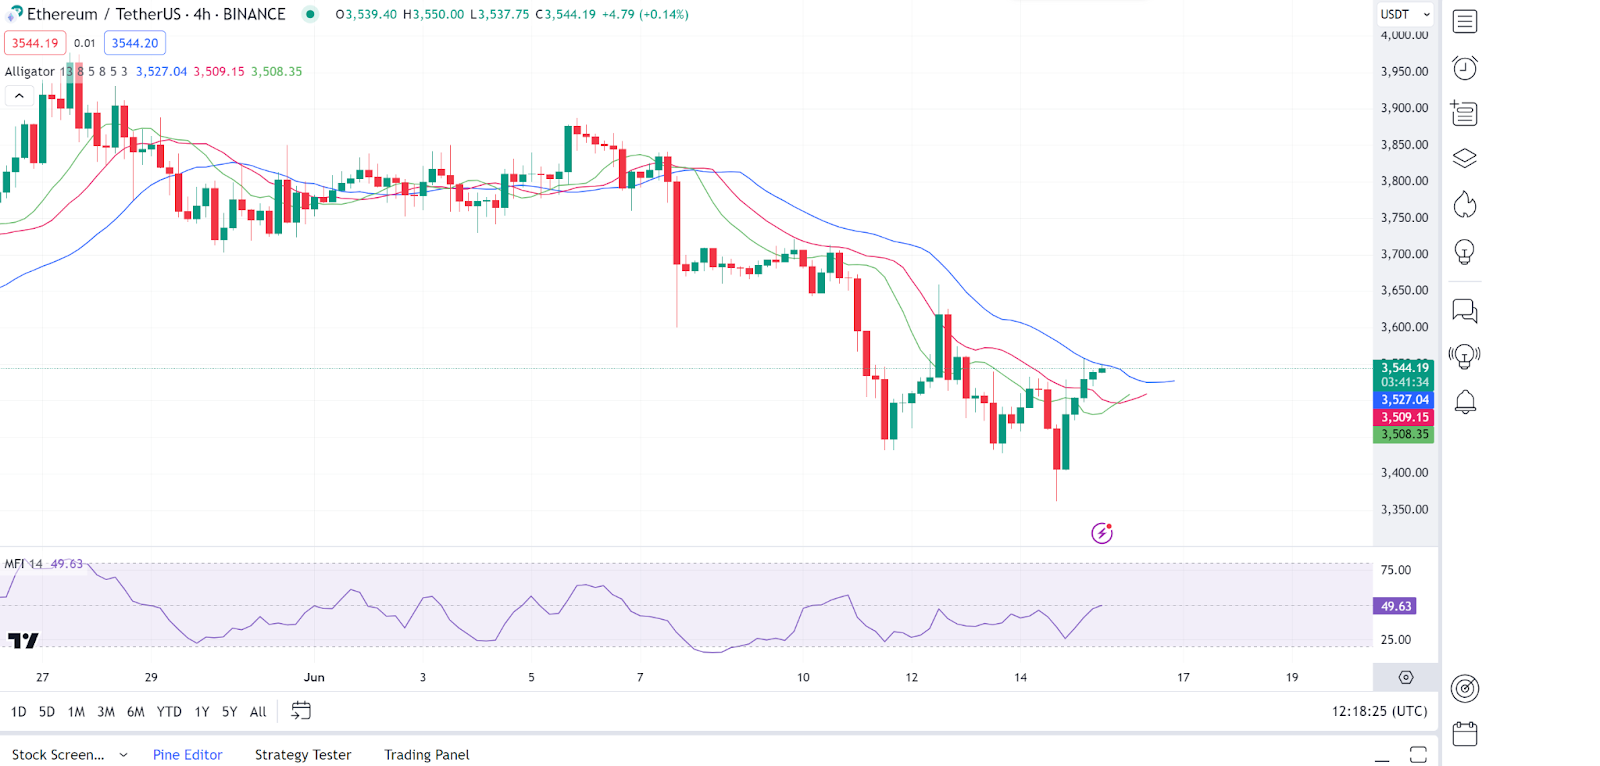
Ethereum (ETH) is another gainer in today’s session as evidenced by its price movements in today’s session. Looking at an in-depth analysis, we see that Ethereum’s chart shows some consolidation around the $3,500 level with slight bullish recovery attempts being capped by the downward sloping moving averages.
On the other hand, we see that the MFI indicator is trending upwards, signaling increasing buying pressure, although the price remains under key moving averages which might act as resistance. As of press time, the Ethereum price stood at $3,540, representing a 0.97% drop from its previous 24-hour price.
Lido DAO Price Review
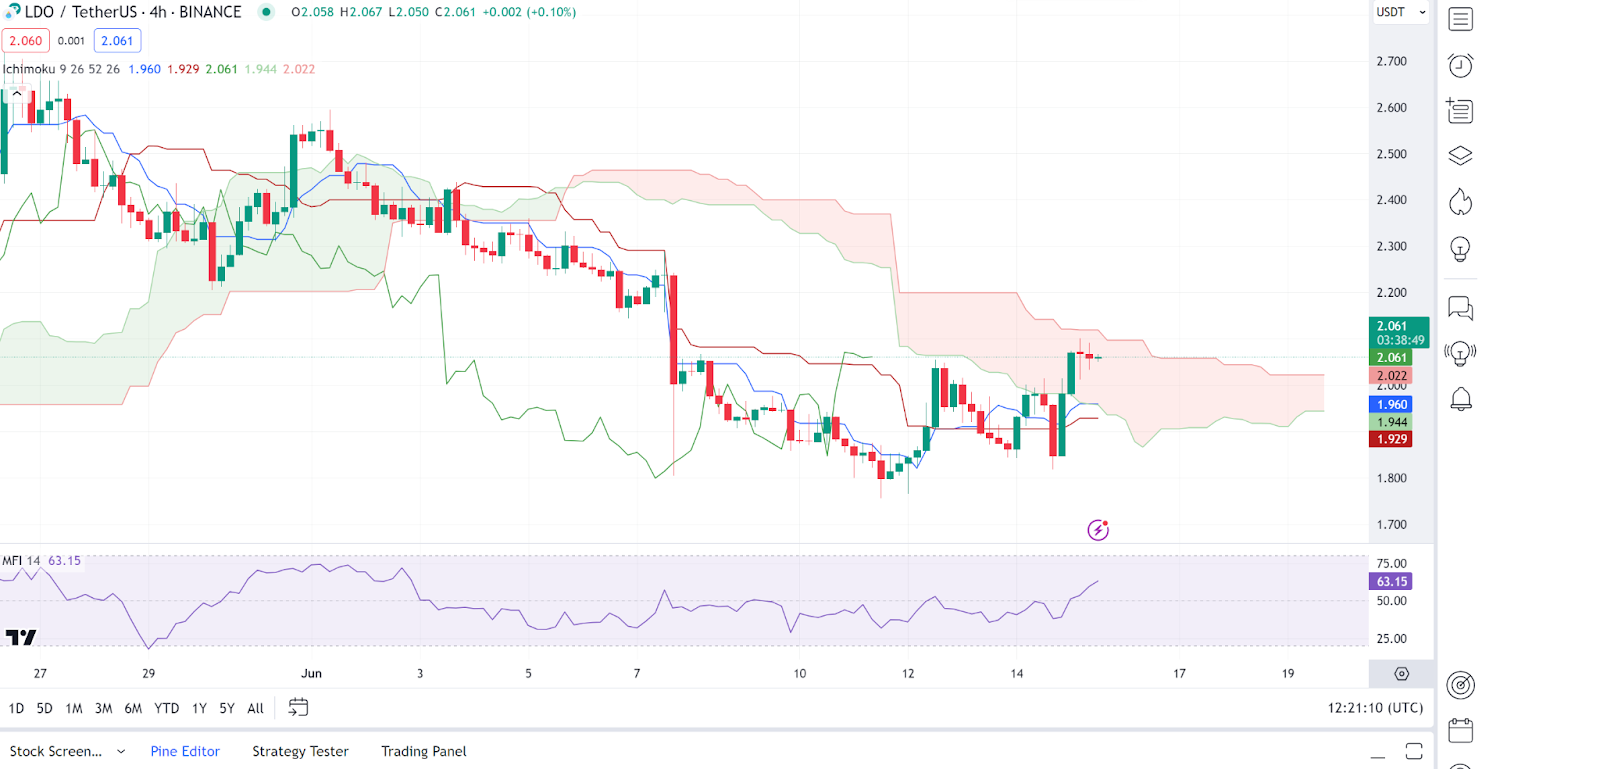
Lido DAO (LDO) is also another gainer in today’s session as seen from today’s price meovements. Looking at an in-depth analysis we see that LDO’s chart indicates a recent sharp drop followed by some stabilization. The price is oscillating around the mid-range of the Ichimoku cloud, suggesting uncertainty and a lack of clear directional momentum.
On the other hand, we see that the MFI shows a neutral sentiment, neither indicating strong buying nor selling pressure, maintaining around the midpoint level. As of press time, the Lido DAO price stood at $2.05 representing a 3.38% drop from its previous 24-hour price.
Gnosis Price Reveiw
Gnosis (GNO) is also a gainer today’s session as seen from its price movements in today’s session. Looking at an in-depth analysis, we see that GNO shows a somewhat volatile trading pattern, moving inside and below the lower boundary of the Ichimoku cloud, suggesting bearish conditions.
On the other hand, he MACD line is just below the signal line, and histograms are showing a decrease in negative momentum, which might suggest a potential slowing of the downward trend. As of press time, the Gnosis price stood at $326.07 representing a 1.4% jump from its previous 24-hour price.

Optimism Price Review
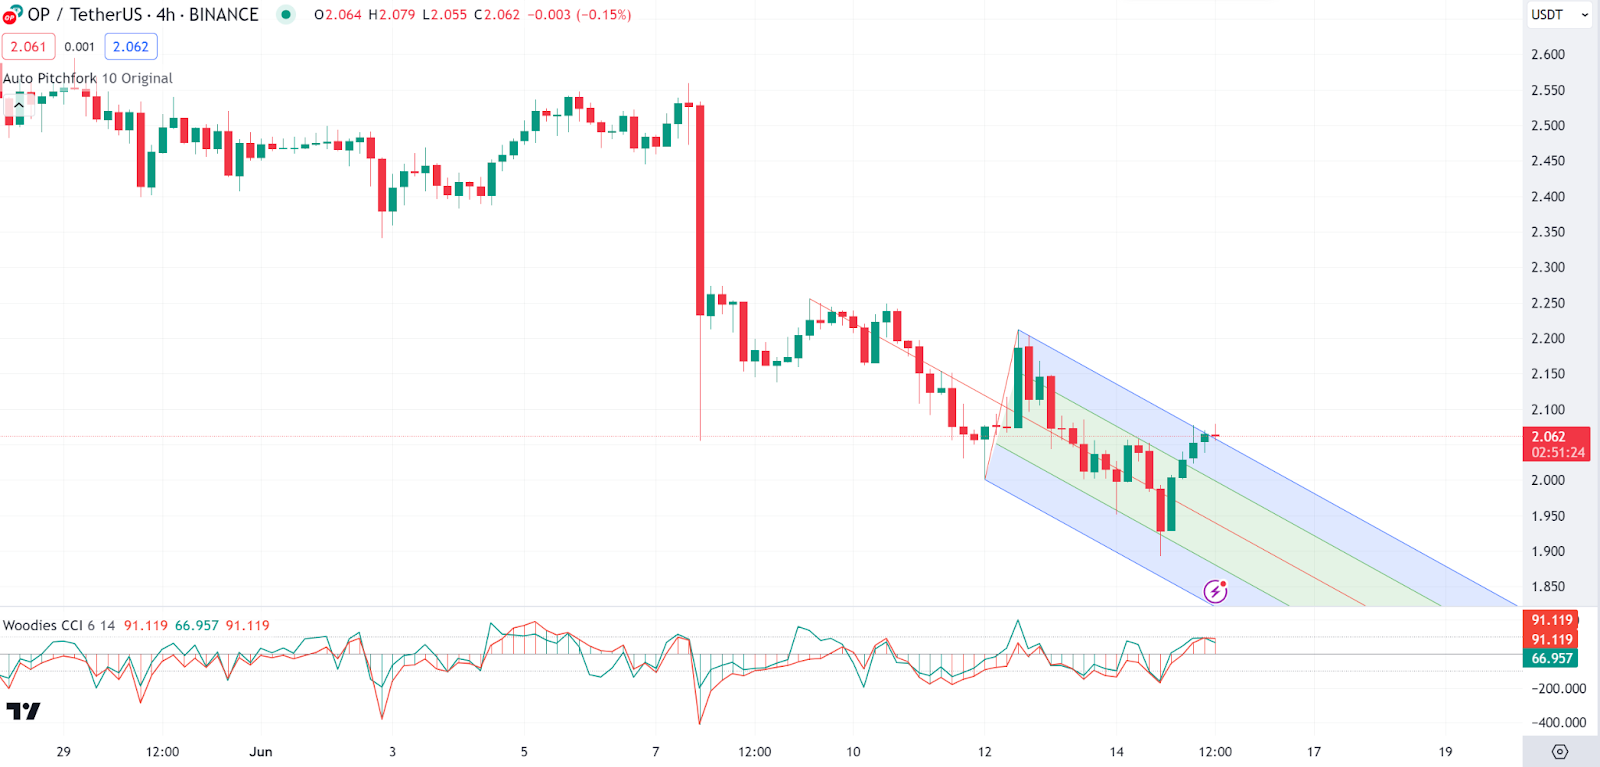
Optimism (OP) is also another gainer in today’s session as seen from its price movements. Looking at an in-depth analysis, we see that the Optimism price is currently below the Ichimoku Cloud, indicating that the market is in a bearish trend in this timeframe. The cloud acts as a resistance area, with the nearest resistance highlighted by the cloud’s bottom around $338.8.
On the other hand, we see that the Moving Average Convergence Divergence (MACD) has recently crossed above the signal line (orange), which is a bullish signal. However, the histogram is still showing negative values, suggesting that the bullish momentum is not very strong yet. As of press time, the Optimism price stood at $2.06 representing a 1.46% jump from its previous 24-hour price.
5d ago•
bullish:
0
bearish:
0
Share
 Manage all your crypto, NFT and DeFi from one place
Securely connect the portfolio you’re using to start.

bullish:
0
bearish:
0

bullish:
0
bearish:
0


bullish:
0
bearish:
0