Daily Market Review: BTC, ETH, SUI, UMA, COTI
3M ago•

bullish:
5
bearish:
0
Share

Bulls have the upper hand on the markets today, as seen from the increasing market cap, which has jumped by 2.1% in the last 24 hours to $1.85 as of press time. The trading volume has also jumped by 28% within the same period as general market activity increases.
Bitcoin Price Review
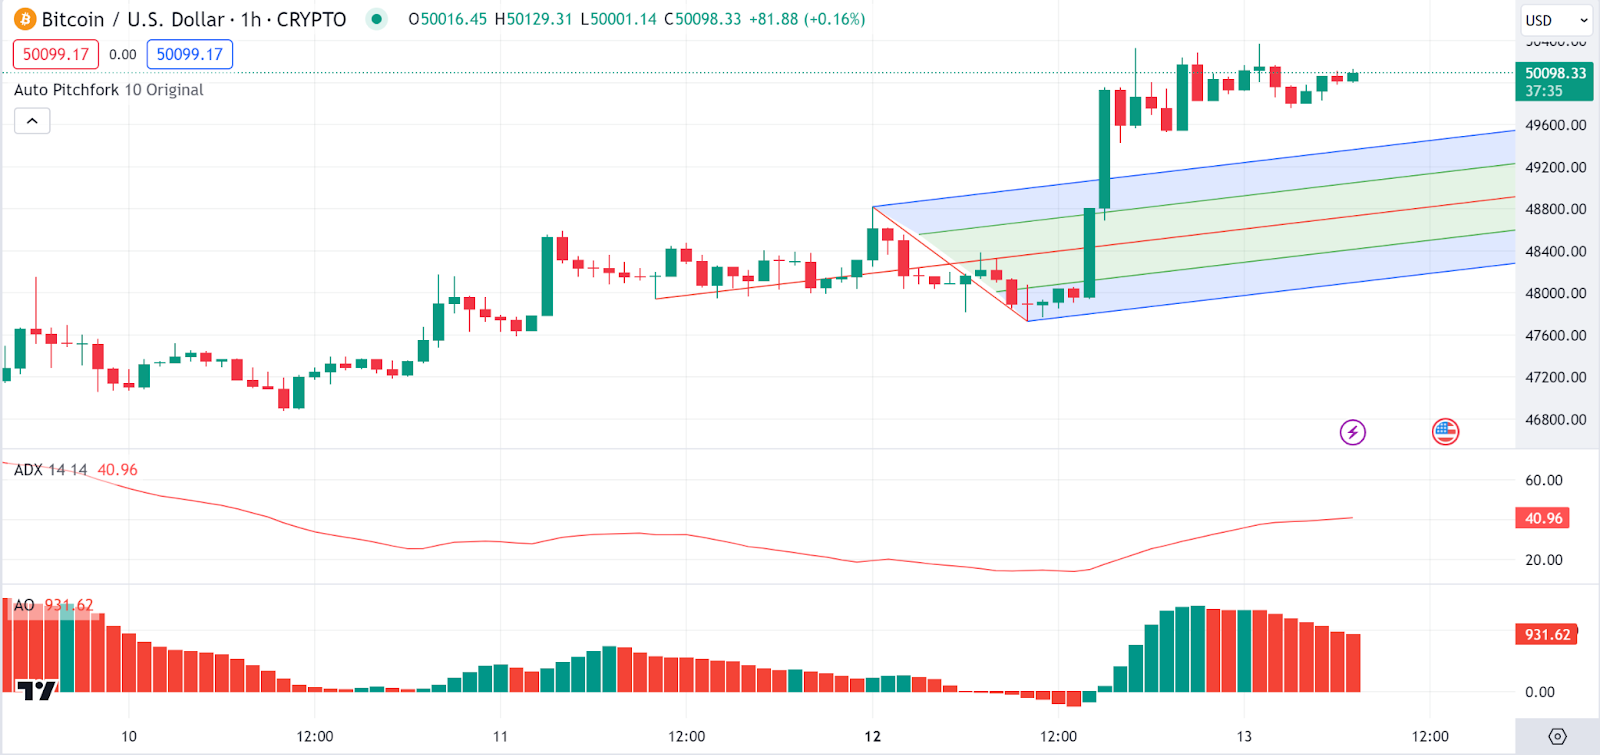
Analysing the 1-hour Bitcoin (BTC/USD) charts, the Bitcoin market shows a consolidating trend within a pitchfork pattern, suggesting a balanced fight between bulls and bears. A significant bullish spike breached the upper boundary of the pitchfork but was followed by a correction, stabilizing the *BTC* around the $50,000 mark.
The ADX indicator at 40.96 indicates a strong trend, while the AO indicator suggests a recent shift in momentum from bearish to bullish. The Bitcoin price stood at $50.011K as of press time, representing a 3.4% increase in the last 24 hours.
Ethereum Price Review
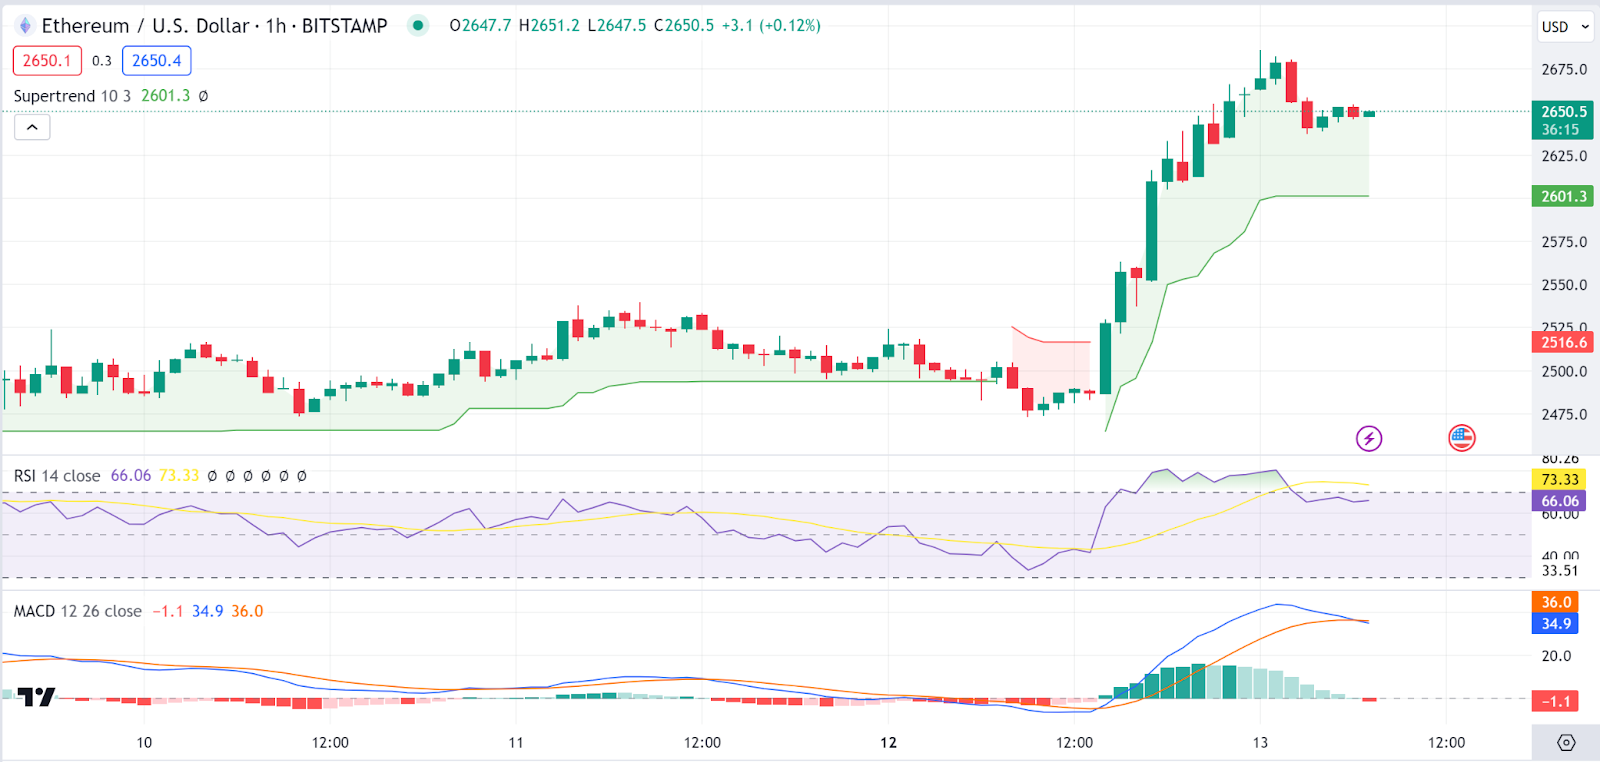
Looking at 1-hour Ethereum (ETH/USD) charts, we also notice that the *ETH* action is portrayed within a ‘Supertrend’ indicator, showing a recent bullish crossover with a sustained uptrend, pushing prices above the $2600 level. The RSI at 73.33 is nearing overbought conditions, which may indicate a potential pullback or consolidation on the Ethereum price soon.
The MACD shows increasing bullish momentum, further supporting the current uptrend. As of press time, the Ethereum price stood at $2644, representing a jump of 5.6% within the last 24 hours.
Sui Price Review
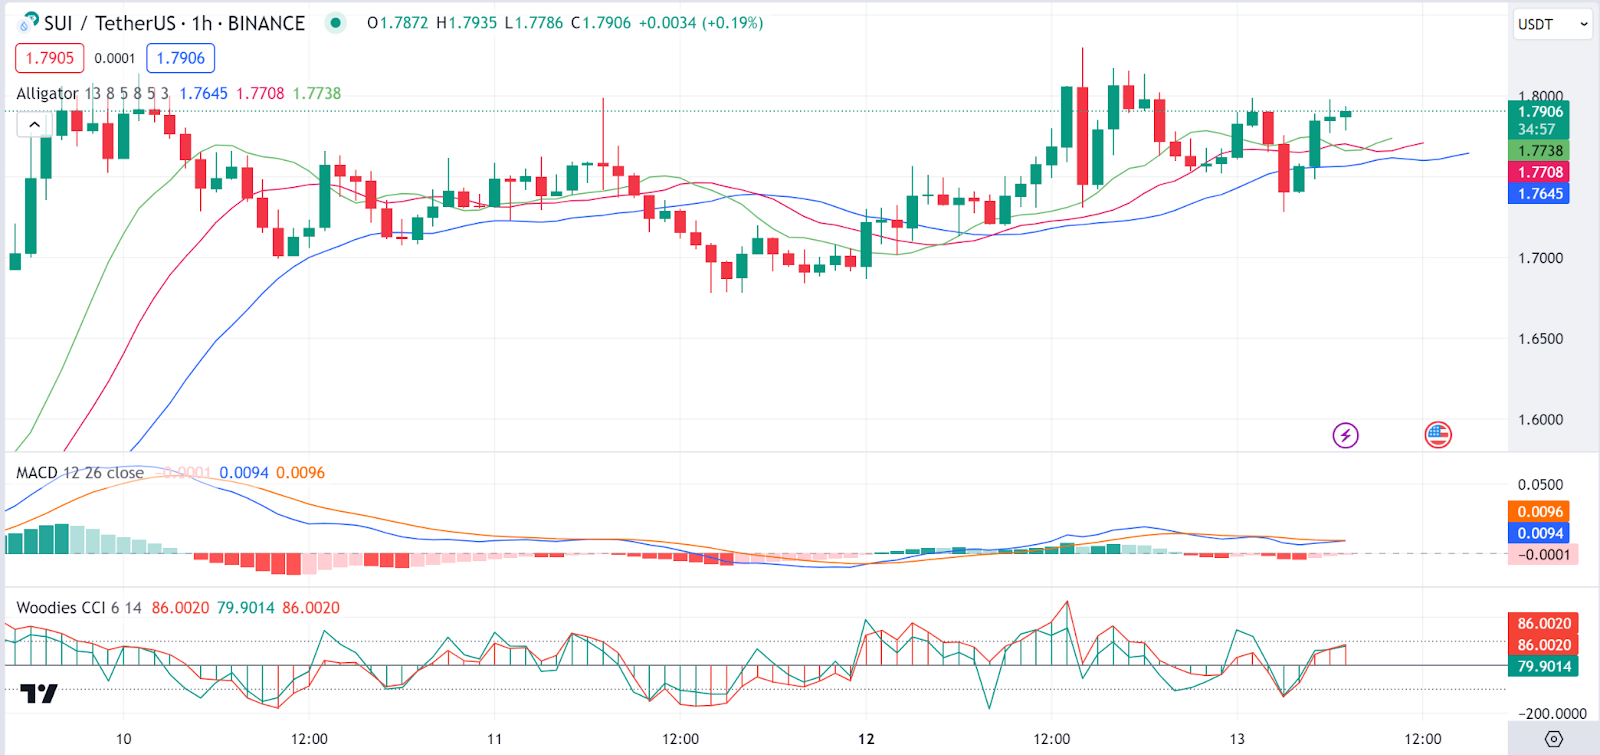
On the other hand, reviewing the 1-hour Sui (SUI/USDT) charts, we notice a sideways trend on the Sui price oscillating around the Alligator indicator lines, signifying indecision in the market. The MACD is flat, reinforcing the lack of clear direction, while the Woodies CCI suggests that the market is not overbought or oversold.
The Sui price stood at $1.8 as of press time, representing a 3.4% increase within the last 24 hours to make today’s top gainers. The trading volume has also jumped by 60% to $496 million.
UMA Price Review
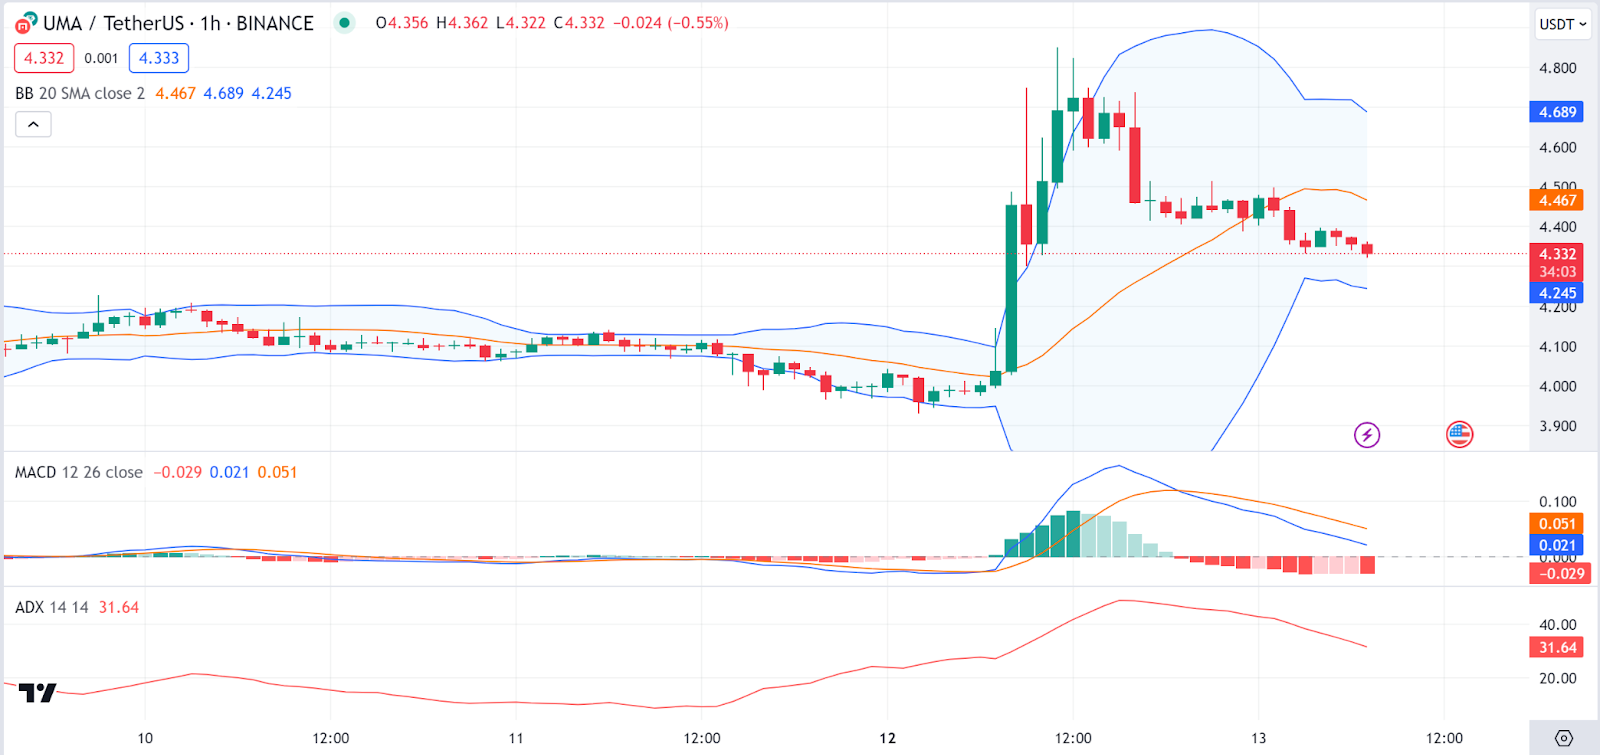
Uma is another gainer today, as seen from an in-depth analysis of 1-hour UMA (UMA/USDT) charts. The study shows that UMA’s market has recently experienced a volatile spike, as indicated by the Bollinger Bands widening significantly. However, the price has reverted to mean levels, trading close to the middle band. The MACD histogram shows diminishing bullish momentum, and the ADX at 31.64 suggests a developing trend.
The Uma price stood at $4.36 as of press time, representing a 7.3% increase within the last 24 hours, while the trading volume also jumped by a massive 715% to $193 million as of press time.
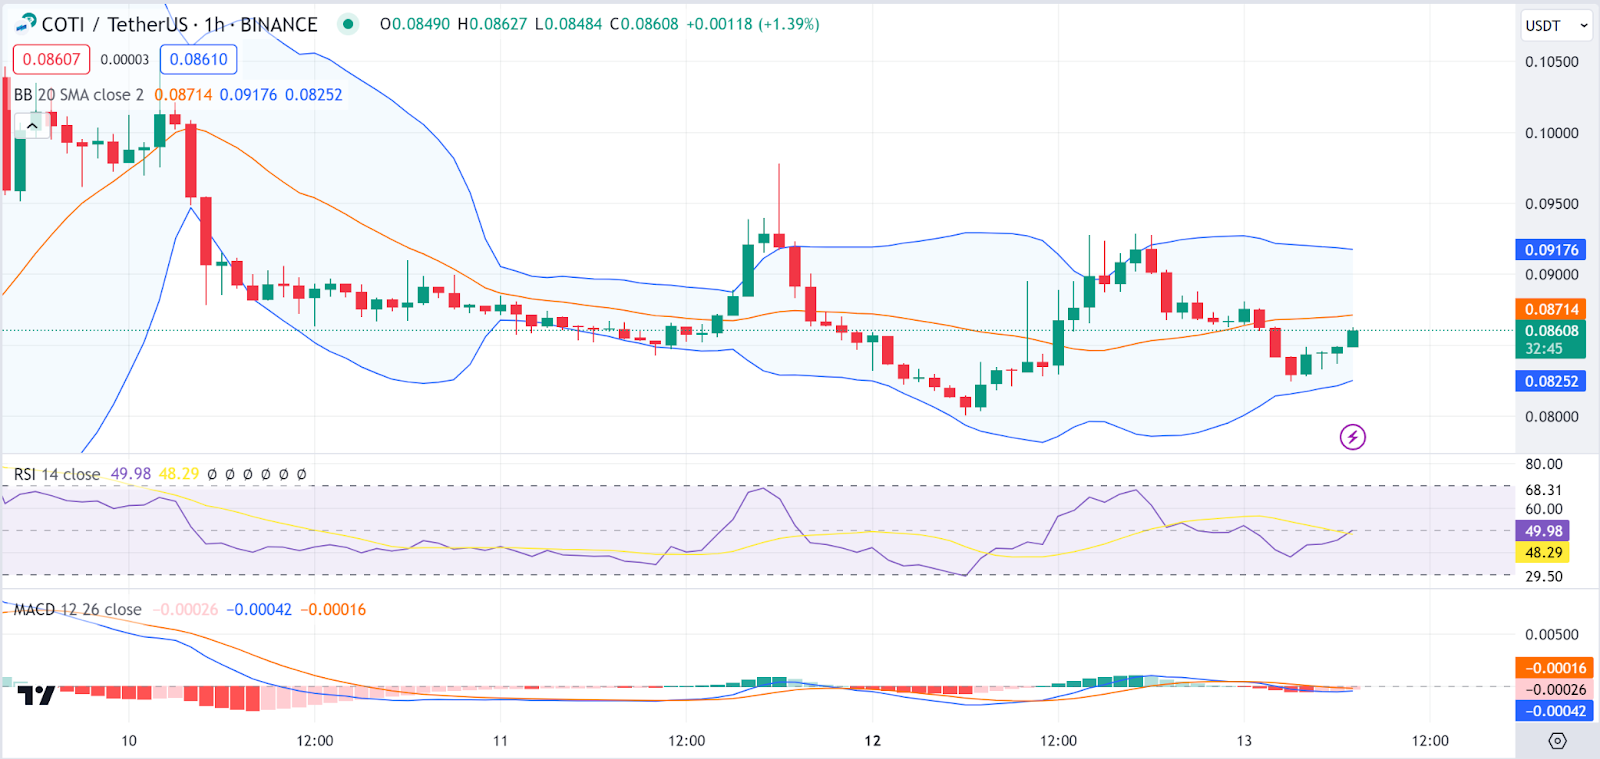
COTI Price Review
COTI is our last gainer of the day as also seen from a study of 1-hour COTI (COTI/USDT) charts. COTI is trading in a relatively narrow range with the Bollinger Bands constricting, which often precedes a period of volatility on the COTI price. The RSI at 48.29 indicates a neutral momentum, and the MACD line is close to the signal line, suggesting a lack of strong momentum.
The COTI price stood at $0.0918 as of press time, representing a 12.1% increase within the last 24 hours, while the trading volume also jumped by 23% within the same period to $53 million as trading activities generally increased across markets.
3M ago•
bullish:
5
bearish:
0
Share


 Manage all your crypto, NFT and DeFi from one place
Securely connect the portfolio you’re using to start.

bullish:
0
bearish:
0


