Ethereum’s blue chip DeFi tokens poised for growth
2
0

Ethereum’s blue-chip DeFi tokens are garnering significant attention in the crypto market, serving as a barometer for the broader DeFi landscape. These tokens, including Uniswap (UNI), Aave (AAVE), Maker (MKR), Curve (CRV), Synthetix (SNX), Compound (COMP), Balancer (BAL), Sushiswap (SUSHI), represent the most established and widely used DeFi protocols. As key players in the DeFi ecosystem, their performance provides valuable insights into the overall health and trends within this innovative financial sector.
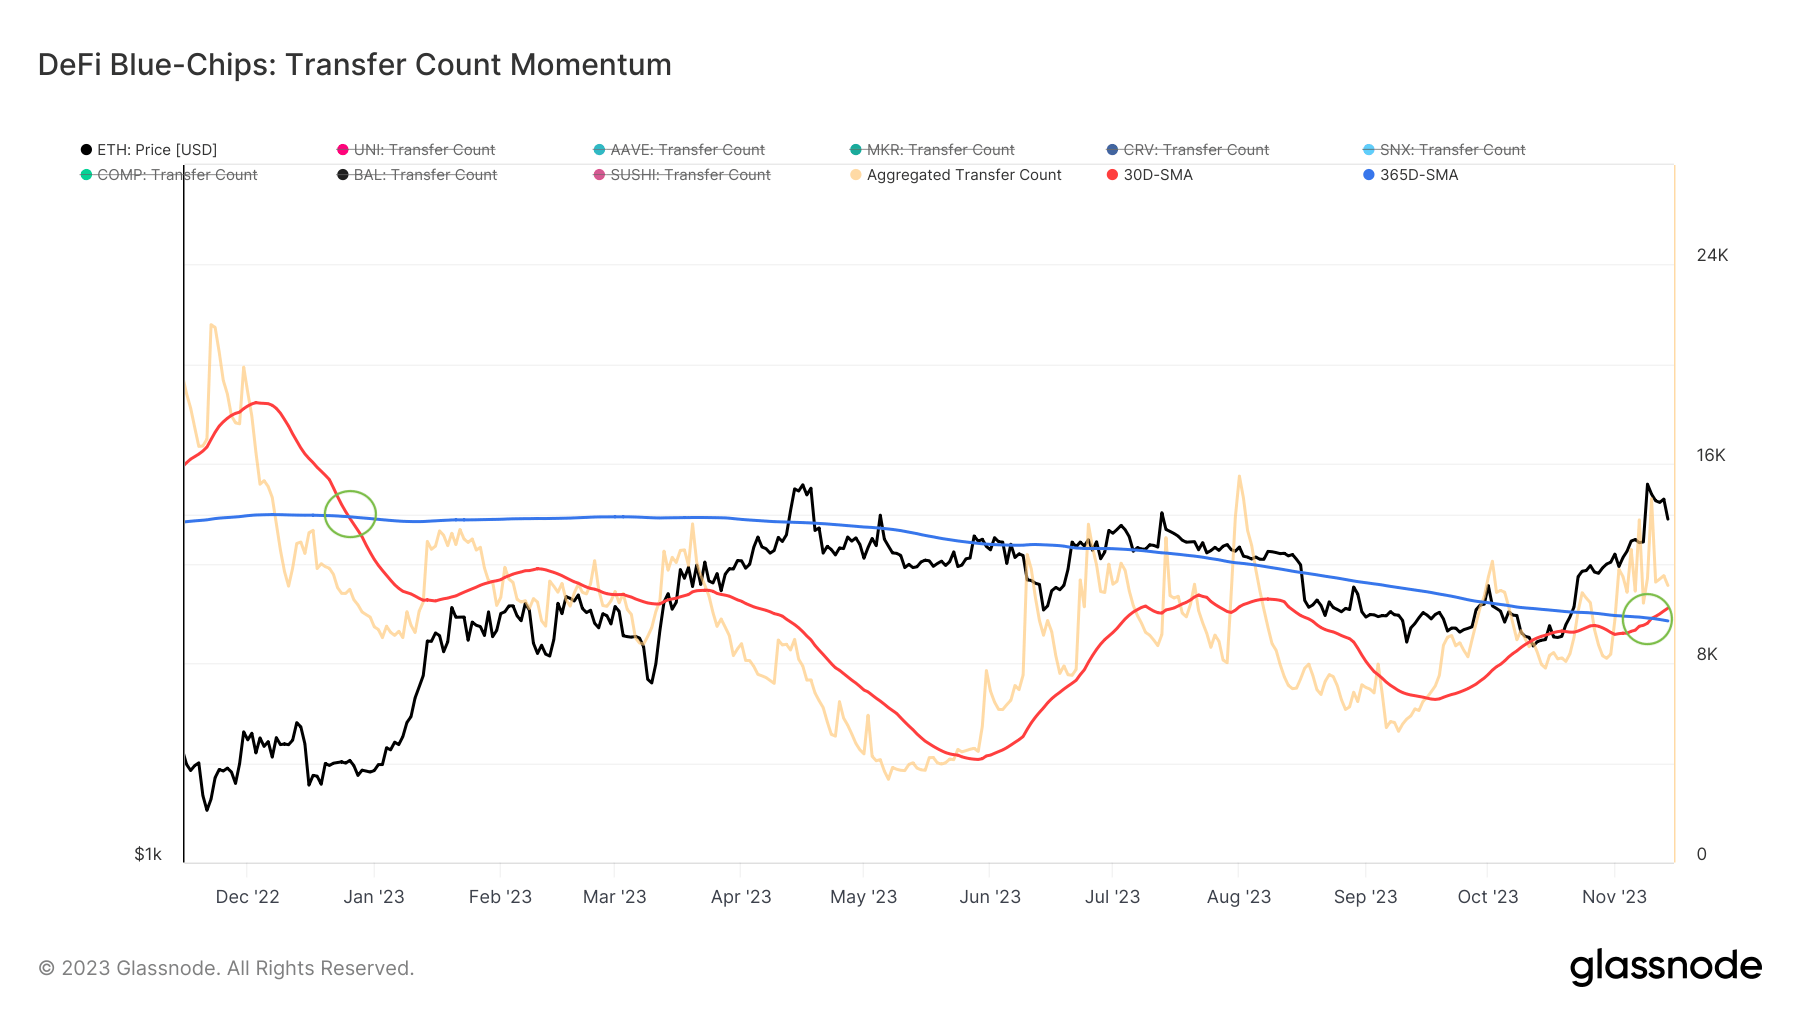
A critical aspect of understanding these blue-chip tokens lies in analyzing the momentum of DeFi token transfers. Transfer counts, a metric that measures the number of token transactions over a period, offer a glimpse into the token’s utility and demand. Specifically, comparing the 30-day Simple Moving Average (30D-SMA) and the 365-day Simple Moving Average (365D-SMA) provides a clear picture of short-term versus long-term trends. A monthly average surpassing the yearly average typically signals an expansion in on-chain activity, suggesting a growing demand for DeFi tokens. Conversely, a monthly average falling below the yearly average indicates a contraction.
Recent data indicates a significant shift in this metric for Ethereum’s blue-chip DeFi tokens. As of Nov.14, the 30D-SMA stood at 12,208, surpassing the 365D-SMA of 9,699. This marks a notable increase in on-chain activity and points to a heightened interest in DeFi tokens. Such a trend reversal, especially after a prolonged period of the 30D-SMA trailing below the 365D-SMA since late 2022, hints at a potential upswing in the DeFi market.

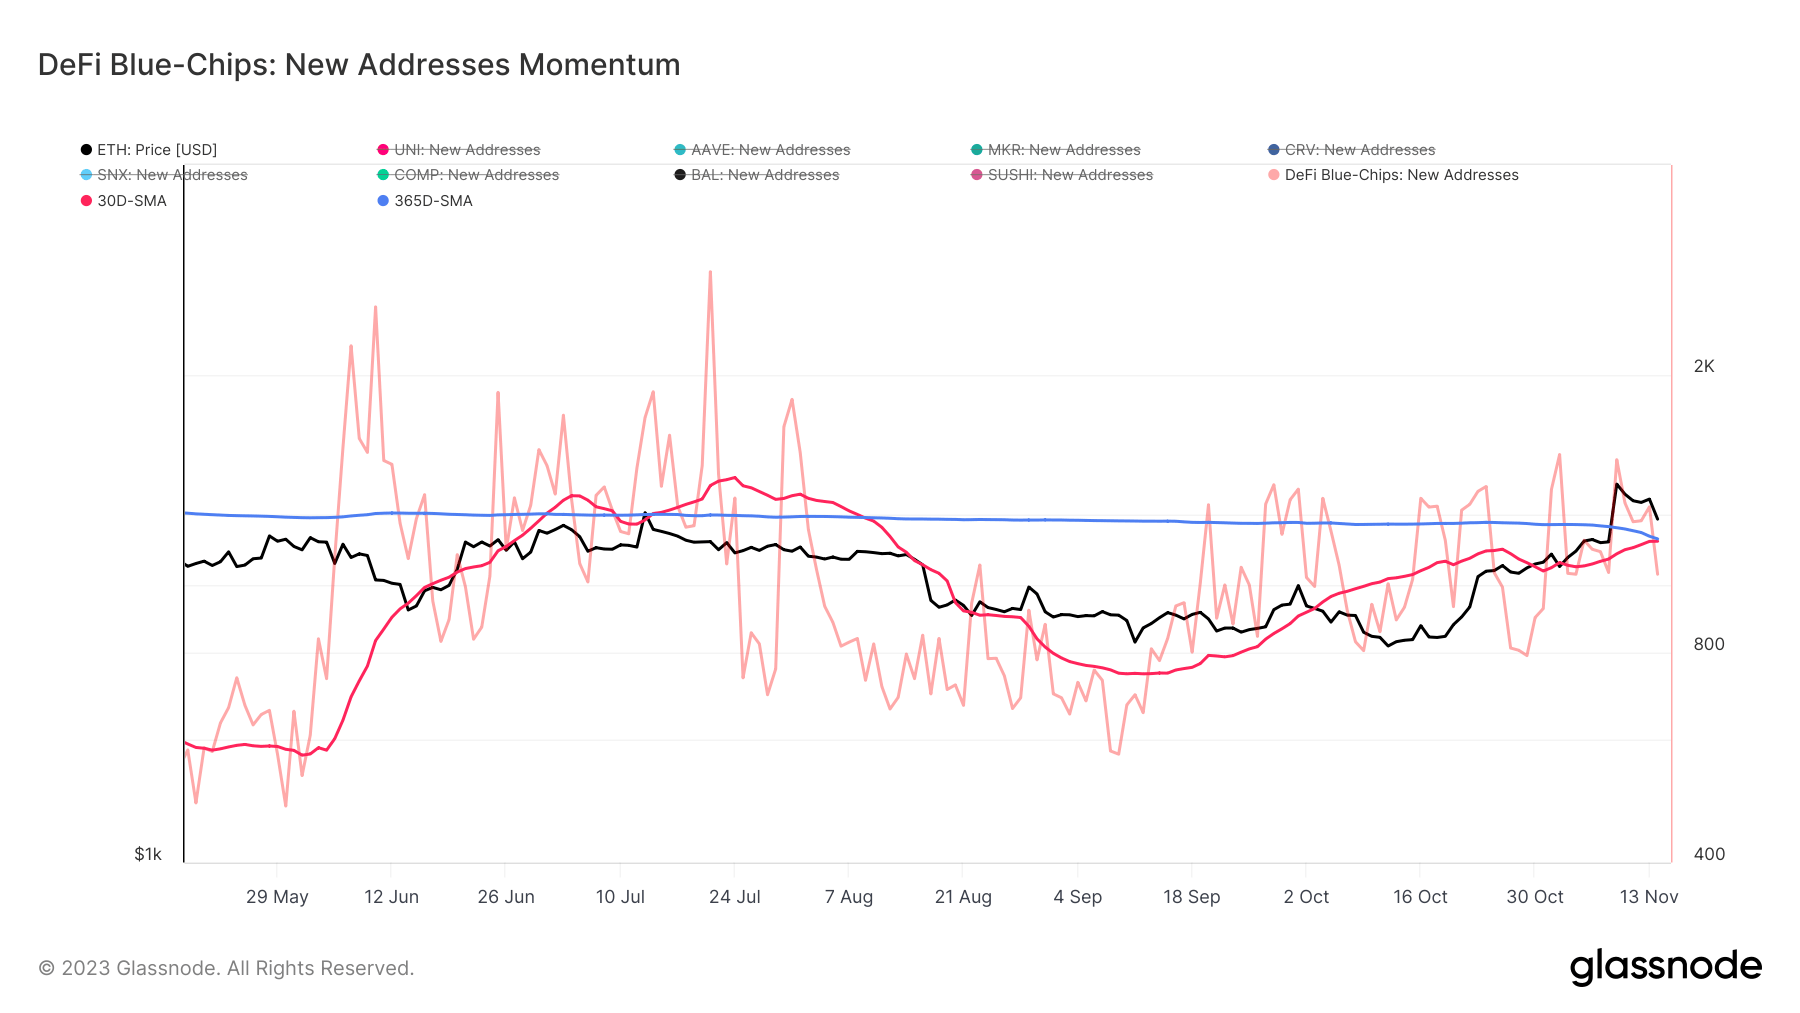
Another crucial factor in assessing the DeFi space is the momentum of new DeFi addresses. The creation of new addresses on the blockchain is a direct indicator of new user adoption and market expansion. Like transfer counts, comparing the monthly and yearly averages of new addresses reveals important market trends. When the monthly average nears or surpasses the yearly average, it suggests an increase in new user adoption, reflecting growing interest in DeFi products.
The data shows this is a pivotal moment for Ethereum’s blue-chip DeFi tokens regarding new address creation. The 30D-SMA of new addresses almost converged with the 365D-SMA on Nov. 14, standing at 1,155 compared to 1,165 respectively. This convergence indicates a resurgence in new user adoption, a vital sign of health and growth in the DeFi ecosystem.

Currently, the DeFi market is at a crossroads. The surge in transfer counts and the near-convergence of new address creation both signal a potential turnaround in the market’s trajectory. This suggests a growing demand and utilization of DeFi tokens, coupled with an increasing interest from new or existing users creating more addresses.
However, the sustainability of the growth in new addresses remains a key factor to monitor. A continued increase in new user adoption could signal a robust growth phase for DeFi, potentially leading to broader market adoption and innovation.
The post Ethereum’s blue chip DeFi tokens poised for growth appeared first on CryptoSlate.
2
0


