Crypto Market Price Analysis Today: Bitcoin (BTC), Celestia (TIA), Hedera (HBAR), BONK, IOTA
11d ago•

bullish:
0
bearish:
0
Share

Bitcoin (BTC) and Ether (ETH), the leading cryptocurrencies, are trading within narrow ranges as traders evaluate the broader economic conditions following the recent halving event. The market has stabilized after a period marked by geopolitical tensions involving missile exchanges and the anticipation surrounding the Bitcoin halving.
Currently, there is a cautious atmosphere with neither buyers or sellers taking definitive action. Negative headlines are impacting the market, including the SEC’s apparent hesitation to approve an ETF application, remarks by President Joe Biden on crypto mining, and ongoing outflows from cryptocurrency investment products.
Conversely, a potentially positive development is last week’s pullback, triggered by the liquidation of leveraged positions, which might have removed some excess and established a solid foundation with committed investment. With the halving complete, cryptocurrency investors are showing reluctance to sell, possibly positioning for higher prices in the future. In this article, we’ll explore price charts of leading cryptocurrencies to determine the upcoming support and resistance levels.
Bitcoin (BTC) Price Analysis
The bears are attempting to halt Bitcoin’s recovery above the moving averages strongly as *BTC* price continues to struggle in surging above the $67K mark. This has resulted in a consolidation within an ascending channel pattern.
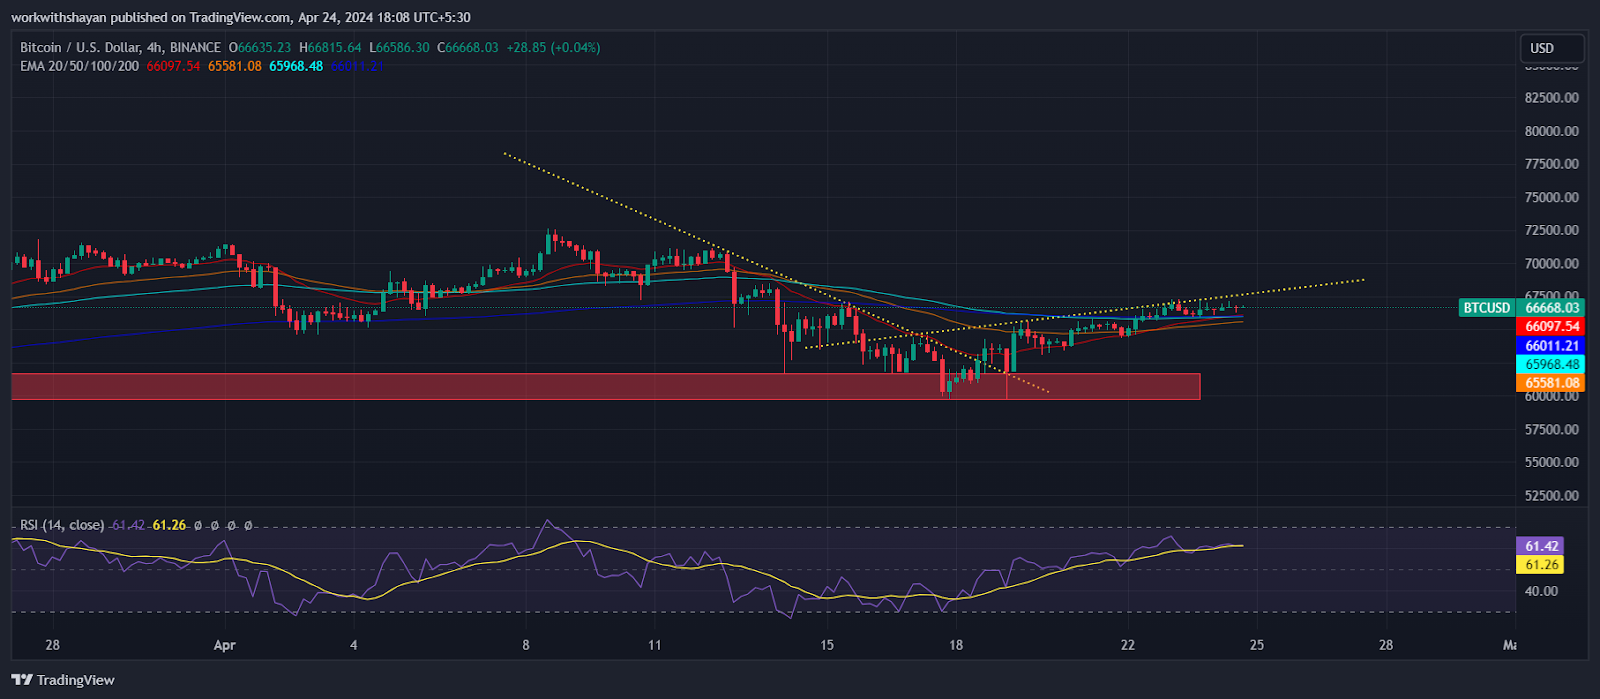
BTC/USDT Chart On TradingView
The stabilization of the 20-day EMA and the Relative Strength Index (RSI) nearing the overbought region indicate a declining selling pressure. Should buyers push the price beyond the 50-day Simple Moving Average (SMA) of $67,511, the BTC/USDT pair might go on a rally towards $74K.
For bears to gain control, they must quickly drive the price below the support level of $64,000. Achieving this could initiate a deeper correction towards the 61.8% Fibonacci retracement level at $60K.
Celestia (TIA) Price Analysis
TIA has surged above the 20-day EMA, currently at $11.5, indicating a potential resurgence in bullish momentum. TIA price has been moving within an ascending channel pattern for the past few days, testing the patience of both buyers and sellers.
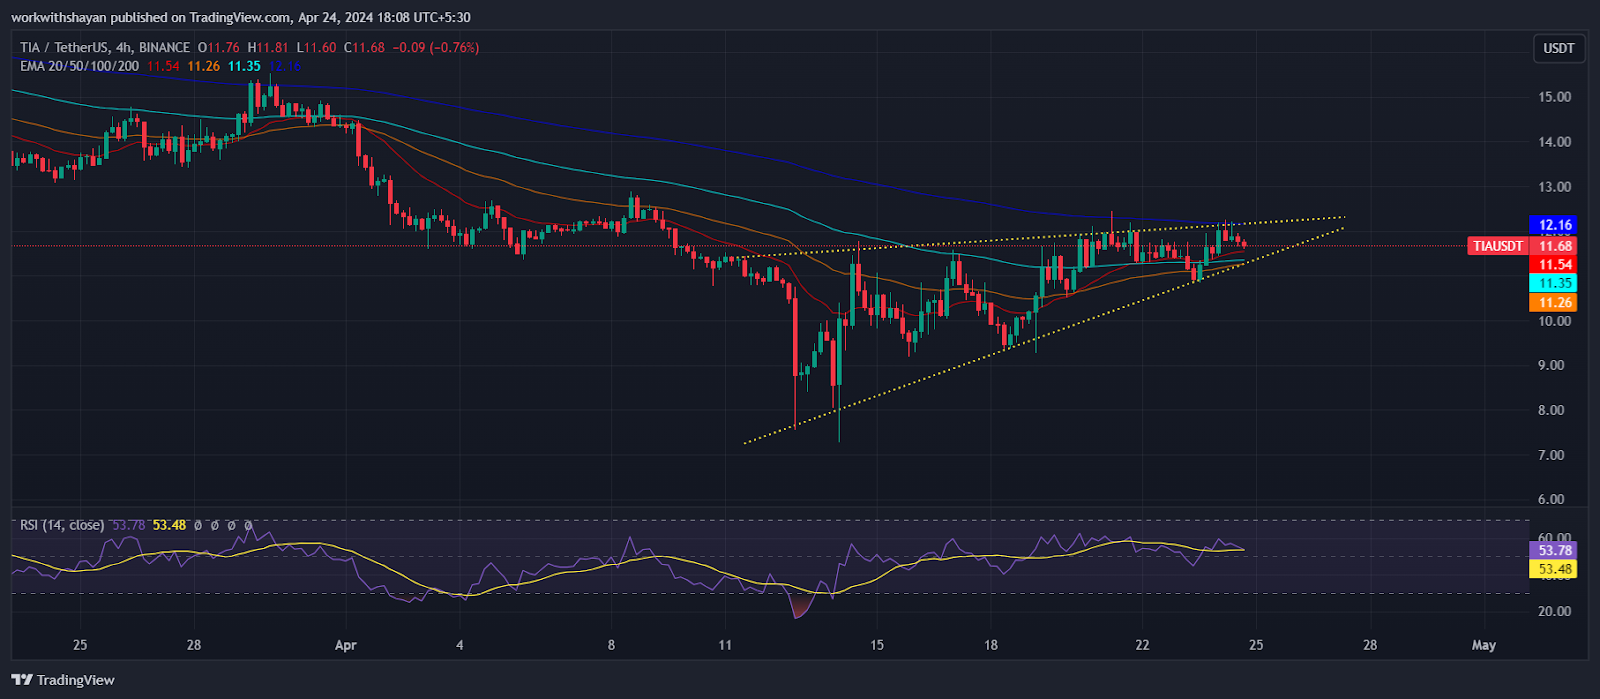
TIA/USDT Chart On TradingView
With the 20-day EMA stabilizing, and the RSI hovering just above the midpoint, there appears to be a balance between supply and demand. Should the price retreat from the 20-day EMA, the TIA/USDT pair could find support around $10.7, a crucial level for bulls to defend. A breach of this support could lead to a further decline below the pattern’s support towards $8.7.
Conversely, a breakout above the channel’s resistance line would reinforce the buyers’ position. In such a scenario, the pair might target the 50-day SMA at $13, followed by a potential move towards $15.5. Surpassing this resistance level could indicate the end of the correction phase.
Hedera (HBAR) Price Analysis
HBAR price made a skyrocketing surge above the 20-day EMA, currently at $0.112, potentially paving the way for a rally towards the overhead resistance at $0.182. However, the price is now facing a strong rejection, leading to a rise in selling pressure. As of writing, HBAR price trades at $0.127, surging over 47% in the last 24 hours.
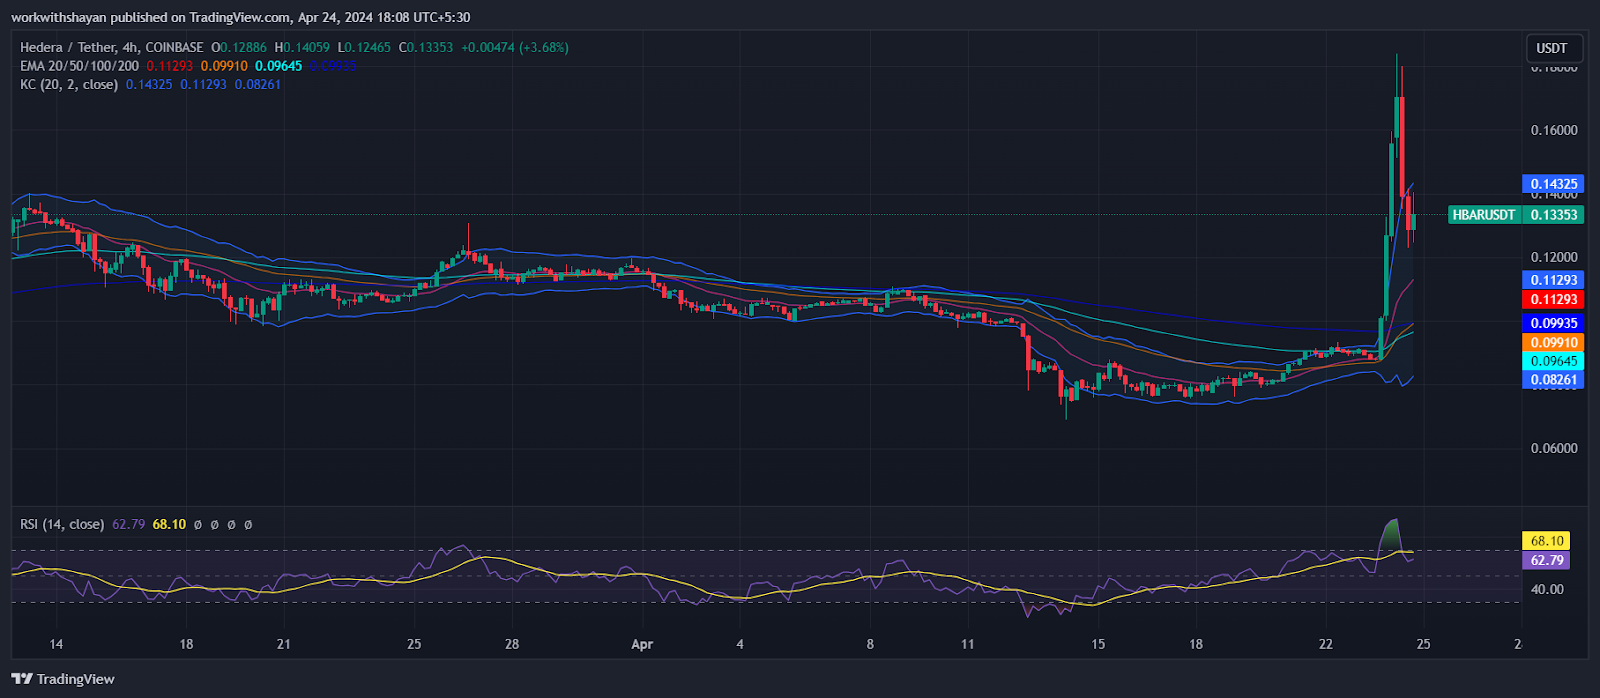
HBAR/USDT Chart On TradingView
A formidable struggle between bulls and bears is anticipated around the $0.182 mark. Should the bulls emerge victorious, the HBAR/USDT pair may go on the next leg of its upward trajectory, aiming for $0.2 and potentially reaching the pattern target of $0.25.
Conversely, a sharp downturn from the overhead resistance would indicate the bears’ determination to maintain control. This could result in the pair retesting $0.1. If bears dominate further, we might see a decline toward $0.072.
BONK Price Analysis
The price of Bonk has exhibited strong upward momentum in recent hours, aiming to break through immediate resistance barriers. However, bears are actively working to halt any further surge, establishing formidable resistance around the $0.00003 level. Currently, the Bonk price is trading at $0.000028, marking a notable 40% increase over the past 24 hours.
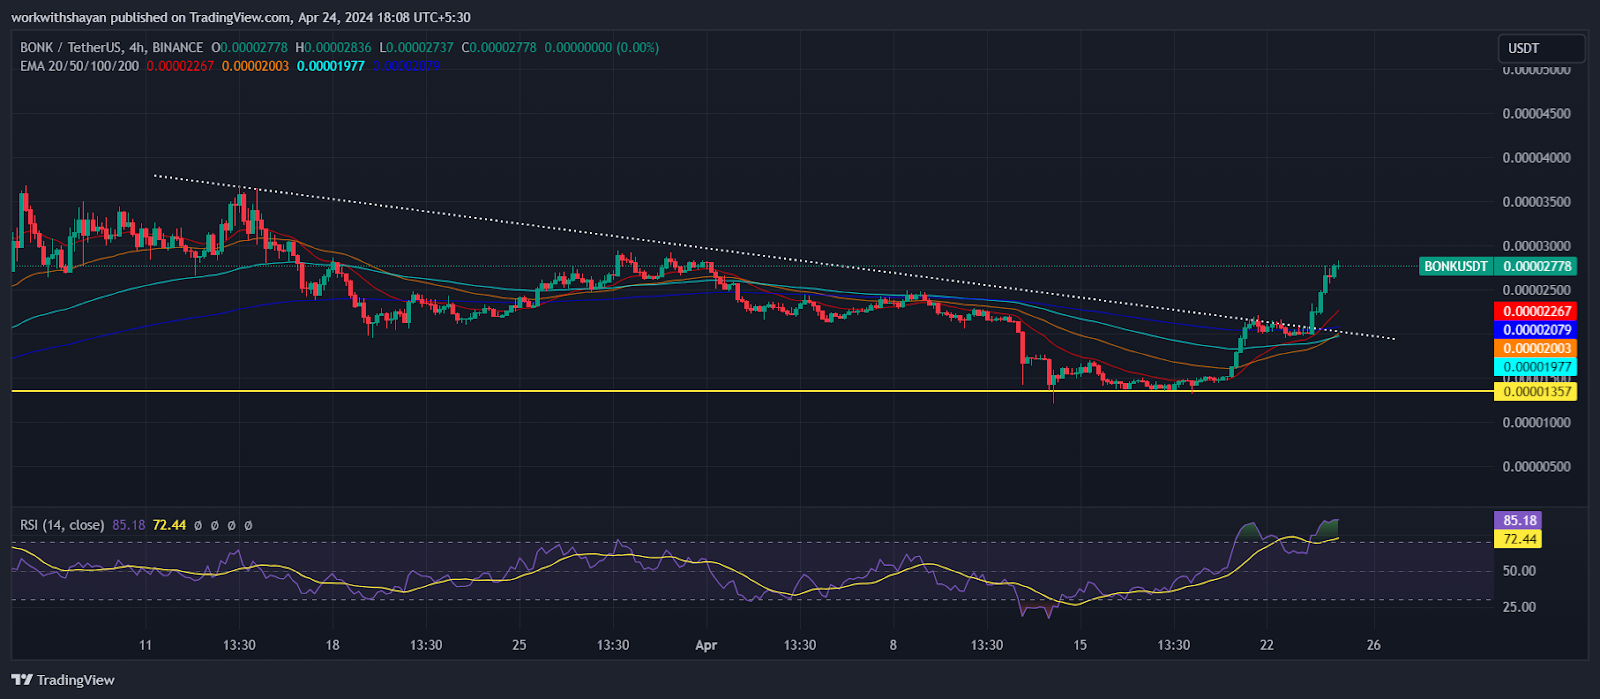
BONK/USDT Chart On TradingView
The BONK/USDT pair seems poised to exceed Fibonacci levels and approach the resistance line at $0.0000301. Bears consider defending this level crucial, as a breach above could signal the end of their bearish dominance. Subsequently, the pair may advance towards $0.0000405 and potentially $0.000045.
On the other hand, a significant downturn from moving averages or the downtrend line would affirm bearish control. In such a scenario, sellers would target pushing the price down to $0.000019 and potentially $0.000012.
IOTA Price Analysis
IOTA has reached its 200-day exponential moving average (EMA) at $0.275, a point where it might encounter significant resistance from sellers. Currently, buyers are aiming to send the price above the descending resistance line to validate a clear trend. As of writing, IOTA price trades at $0.258, surging over 7% in the last 24 hours.
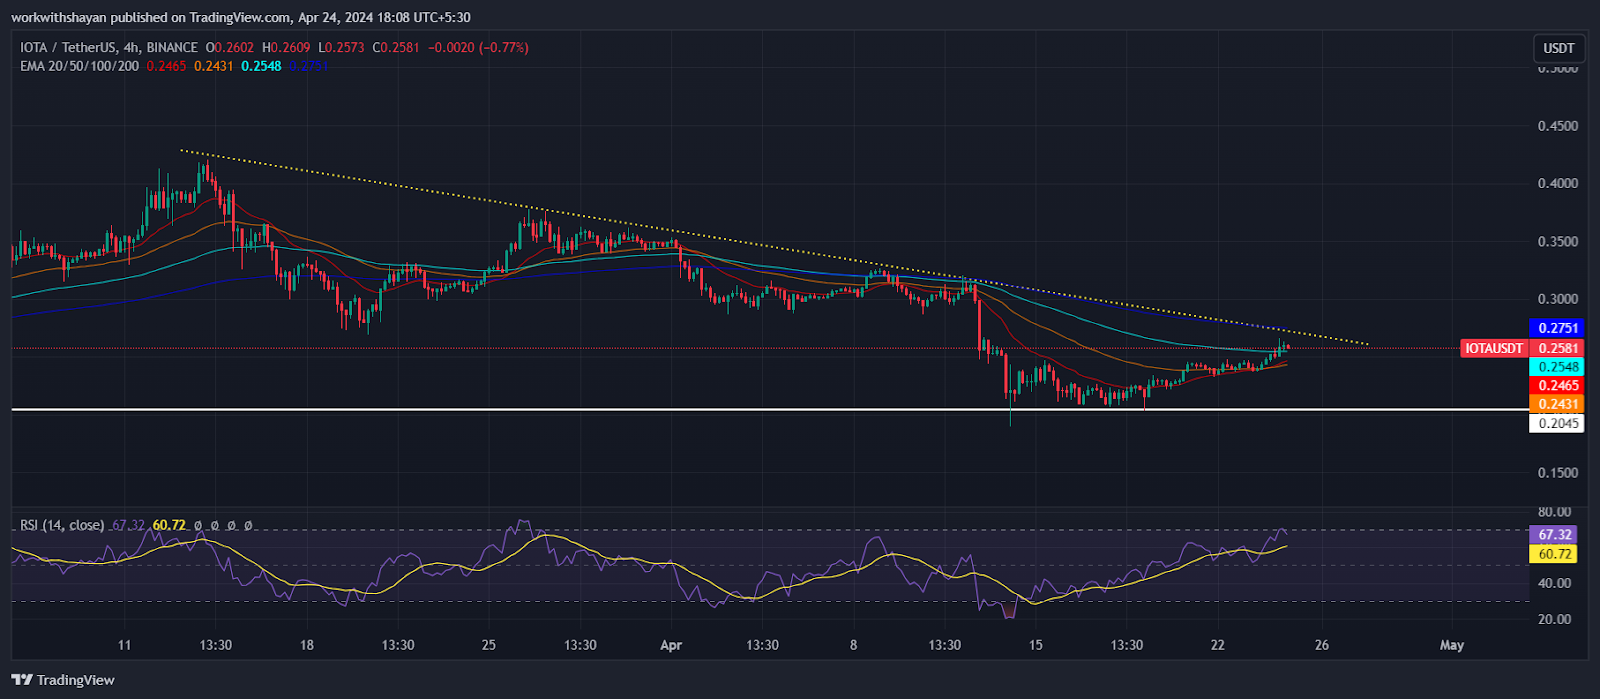
IOTA/USDT Chart On TradingView
Should the price decline from the moving averages, it would indicate that market sentiment is still bearish, with traders likely selling during price rallies. This could lead to a drop towards the strong support level at $0.23. If it breaks below this, it might pave the way for a further decline to $0.2.
Conversely, if the price advances and surpasses the moving averages, it would signal a potential resurgence by the bulls. In this scenario, the IOTA/USDT pair might aim for an upward move towards the next significant resistance at $0.32.
11d ago•
bullish:
0
bearish:
0
Share


 Manage all your crypto, NFT and DeFi from one place
Securely connect the portfolio you’re using to start.

bullish:
0
bearish:
0


