Chainlink May Reclaim $11 Next Month, but This Must Happen First

0
0

Chainlink is currently experiencing notable selling pressure, as is the rest of the market. It retraced by over 4% on Friday and currently trades at $8.53.
The latest decline follows a similar dip on Thursday, when the asset dropped from $ 9.27 to $ 8.78. In hindsight, it had a good start to the week, surging by over 5% on Monday. Over the next two days, it gradually edged upward.
It has since erased all the gains and flipped red on the 1-week scale. Based on the Bollinger bands on the 1-day chart, the asset is due for a rebound. The latest downturn began last week, when it surged above the upper band.
Following the latest decline, the altcoin has retested the lower band. Since the second week of February, it has trended within the bands and may continue to do so this time if it rebounds on Saturday.
However, the chart suggests a 50% probability of a rebound is minimal at the time of writing. The asset recently broke below a critical level. Since last month, Chainlink has traded above $8.50, rebounding off it on several occasions.
In instances where it flipped, prices retraced below $8.40. After losing this mark, the altcoin has gone on to retest the $8 support. At the time of writing, the asset is trading at $8.52. If the bulls continue to defend this mark, it will guarantee a massive uptick. Conversely, losing it could prompt a retest of the $8 support in the coming days.
MACD Hints Chainlink Losing 25%
Amid the bullish reading from the Bollinger bands, the moving average convergence divergence suggests that Chainlink will retrace further. It had its positive crossover in February after several days of trending downward.
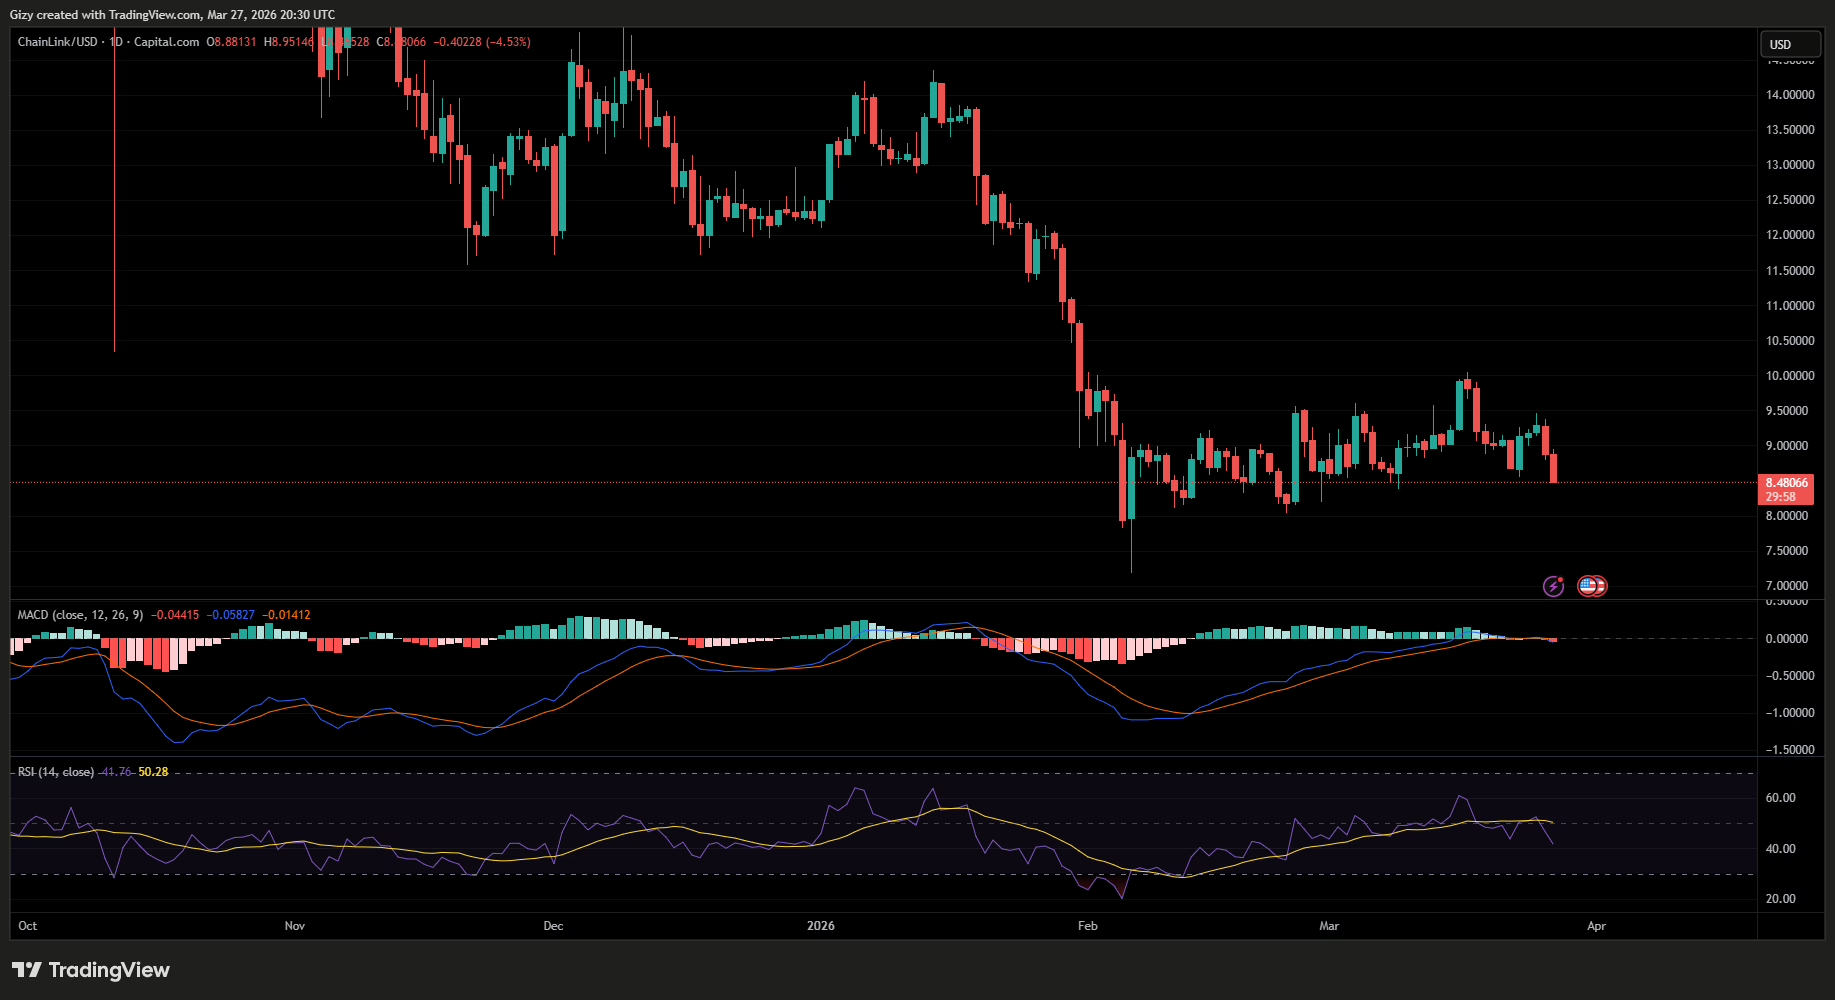
The metric recently flipped bearish a few days ago. It signals that the downtrend is far from over. The last three occasions when it had such a negative divergence have been marked by notable selling pressure. It lost 20%, 14%, and 42% repectively.
On average, the asset sheds 25% after crossover. If the trend repeats this time, LINK will retrace below $7. Going by the lowest, a 14% drop will see the asset rebound at $7.30.
Previous price movement aligns with the latter prediction. Recall that in Feb 6, the asset retraced to a low of $7.18 and sharply rebounded. It created a fair-value gap, stretching from $7.88 to the low. Prices may decline further, filling the gap this time.
Interestingly, the relative strength index shows that the altcoin is experiencing notable selling pressure. Currently trending at 41, showing room for further decline.
In summary, the MACD shows potential for further decline. Previous patterns indicate a likely drop to $7, should selling pressure persist in the coming days.
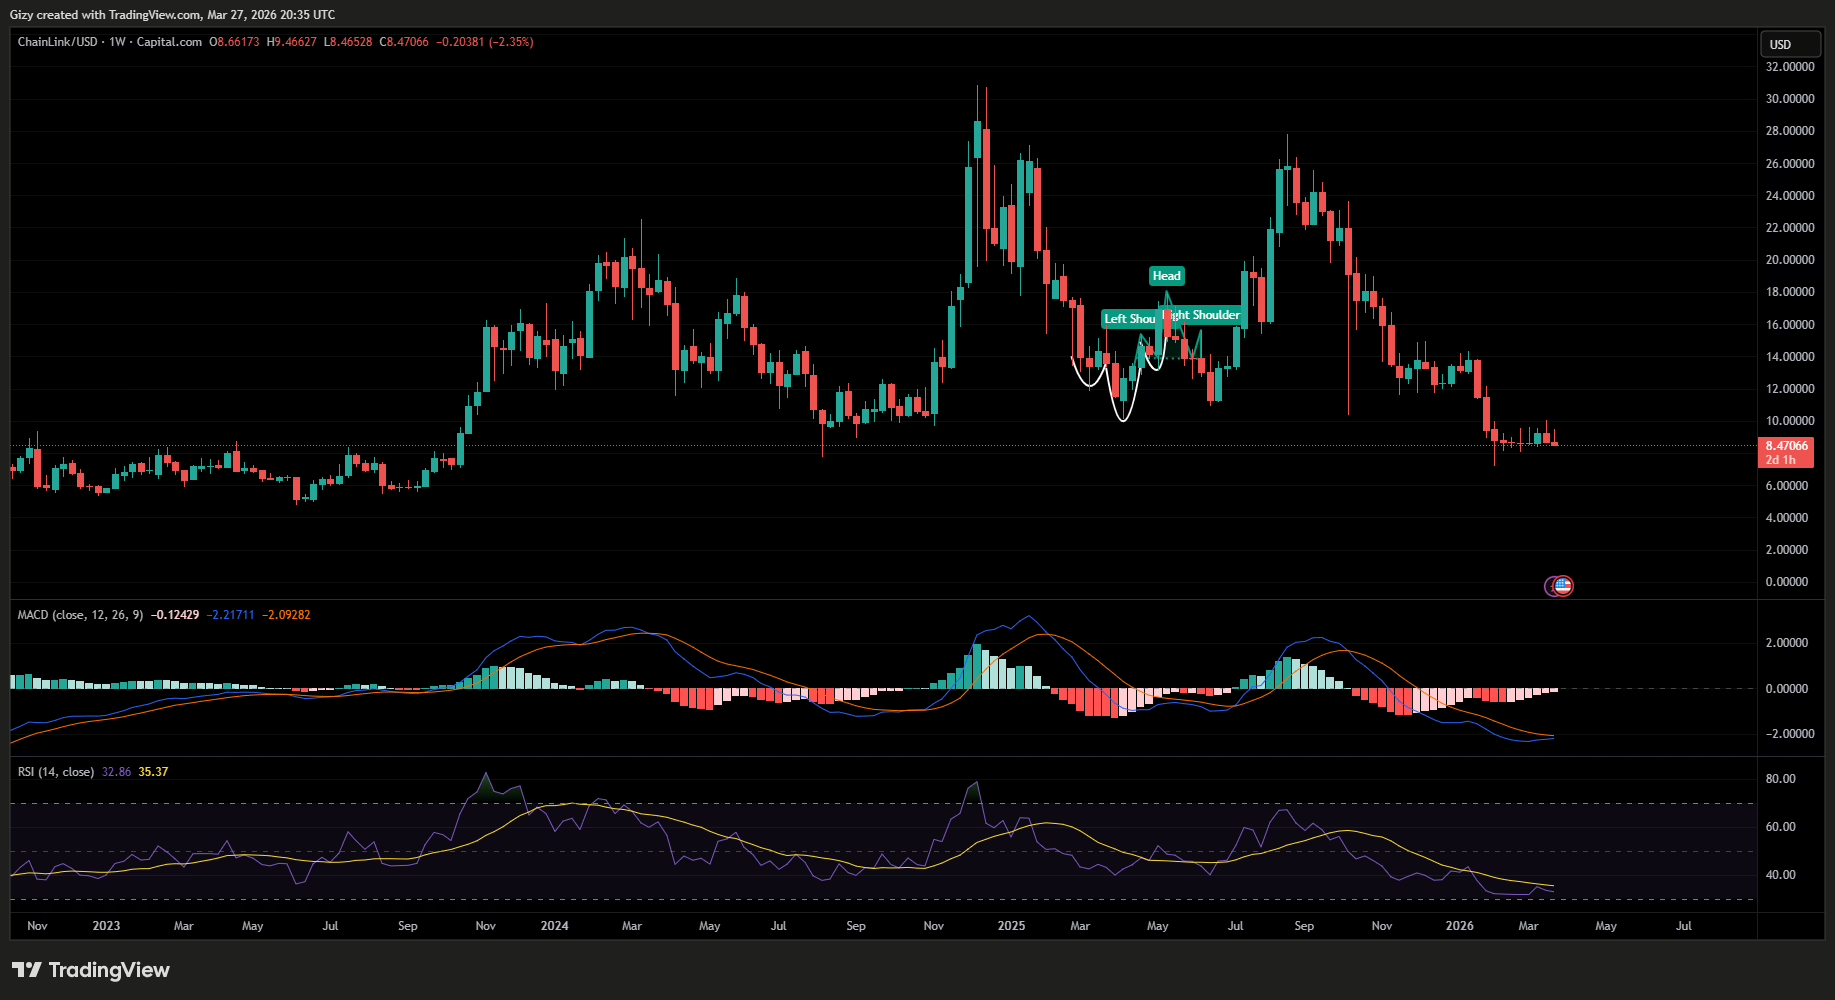
However, amid the negative readings from indicators, there are several bullish signals on the 1-week chart. Since February, the gap between the MACD’s 12- and 26-EMA lines has narrowed. It is at its smallest at the time of writing, hinting at an impending bullish divergence.
Nonetheless, it does not invalidate the bearish readings from the 1-day chart. It means that the asset may surge even higher after the downtrend. Previous price movement suggests a possible retest of $11.
The post Chainlink May Reclaim $11 Next Month, but This Must Happen First appeared first on CoinTab News.
0
0

 Manage all your crypto, NFT and DeFi from one place
Securely connect the portfolio you’re using to start.

0
0

0
0

0
0

0
0