Daily Market Review: BTC, ETH, ANKR, WIF, APT
1M ago•

bullish:
0
bearish:
0
Share

Bulls have displayed quite some dominance in today’s session as evidenced by the massive pump in the global market cap. The total cap stood at $2.69T as of press time representing a 5% pump in the last 24 hours while trading activities also peaked, evidenced by the 41% pump in the global trading volume to stand at $118.62B as of press time.
Bitcoin Price Review
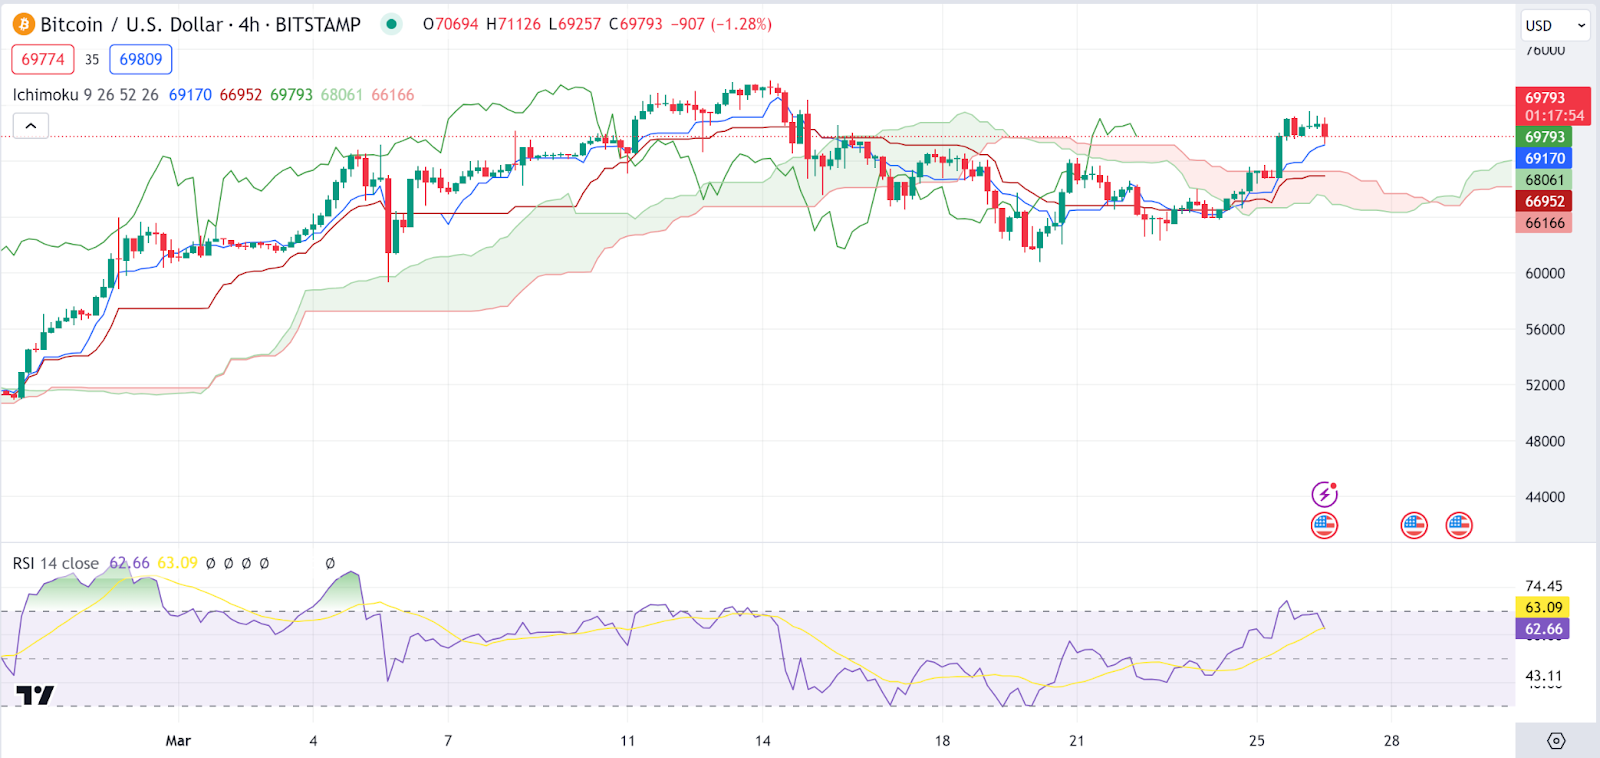
Bitcoin has remained dormant in today’s session as it now consolidates above $70K. The *BTC* chart displays the Ichimoku Cloud, a popular technical analysis indicator. The Bitcoin price oscillates within the cloud, indicating a lack of clear trend direction, which is typical for the Ichimoku when the price is within the cloud.
The cloud itself seems to be expanding, suggesting increased volatility. The Relative Strength Index (RSI) hovers around the mid-range, not indicating overbought or oversold conditions. The Bitcoin price stood at $70.191 as of press time representing a 1.3% pump over the last 24 hours.
Ethereum Price Review
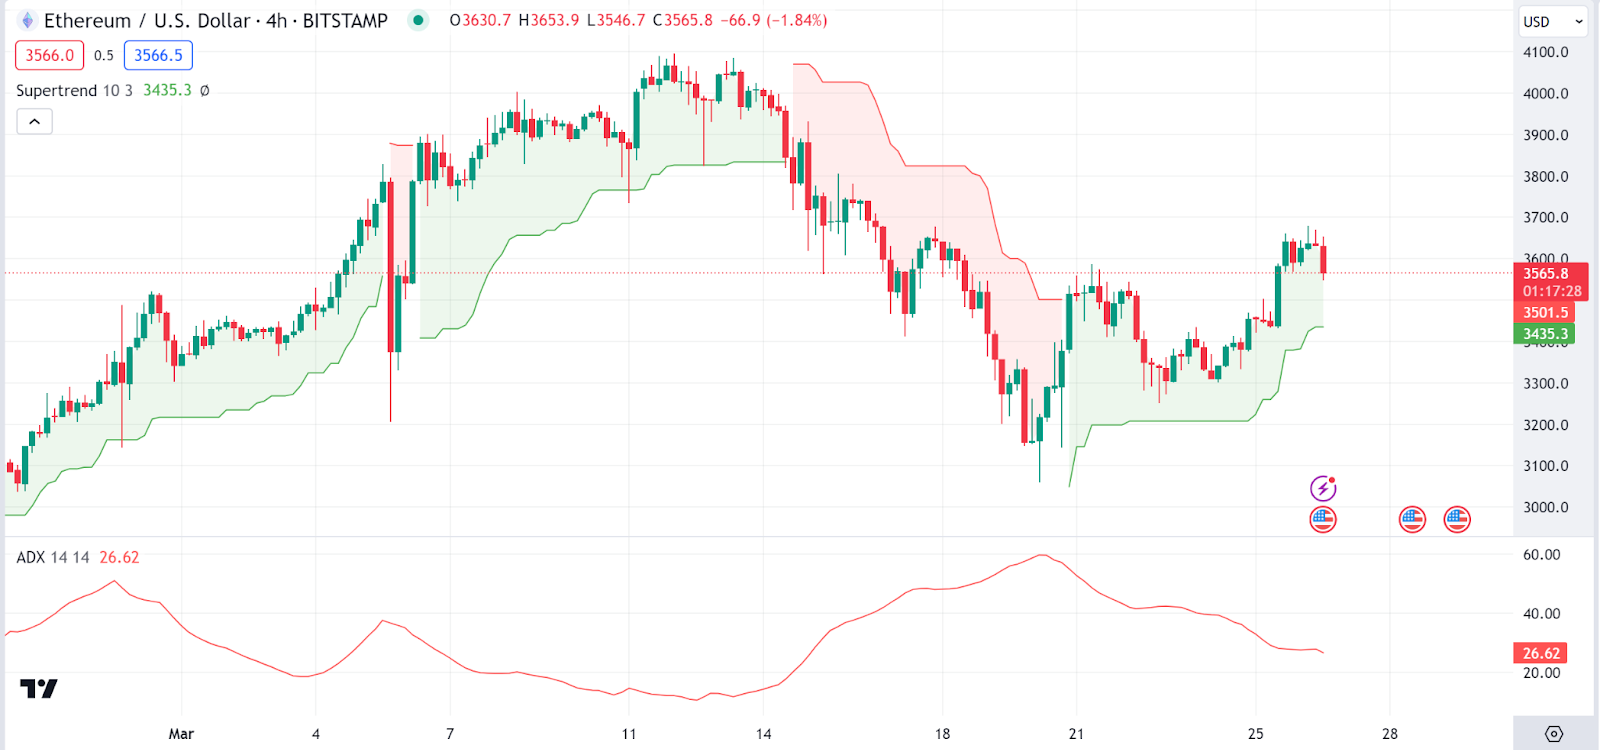
Ethereum has also shown dominance today as it has exceeded $3.5K. Looking at an in-depth analysis of *ETH* charts, we notice the Supertrend indicator, which currently indicates a bullish trend as the price is above the green trend line.
However, the Average Directional Index (ADX), an indicator used in gauging trends, shows a value of around 26, which suggests that the trend is not very strong. The Ethereum price stood at $3,591 as of press time representing a 0.9% pump over the last 24 hours.
Ankr Price Review
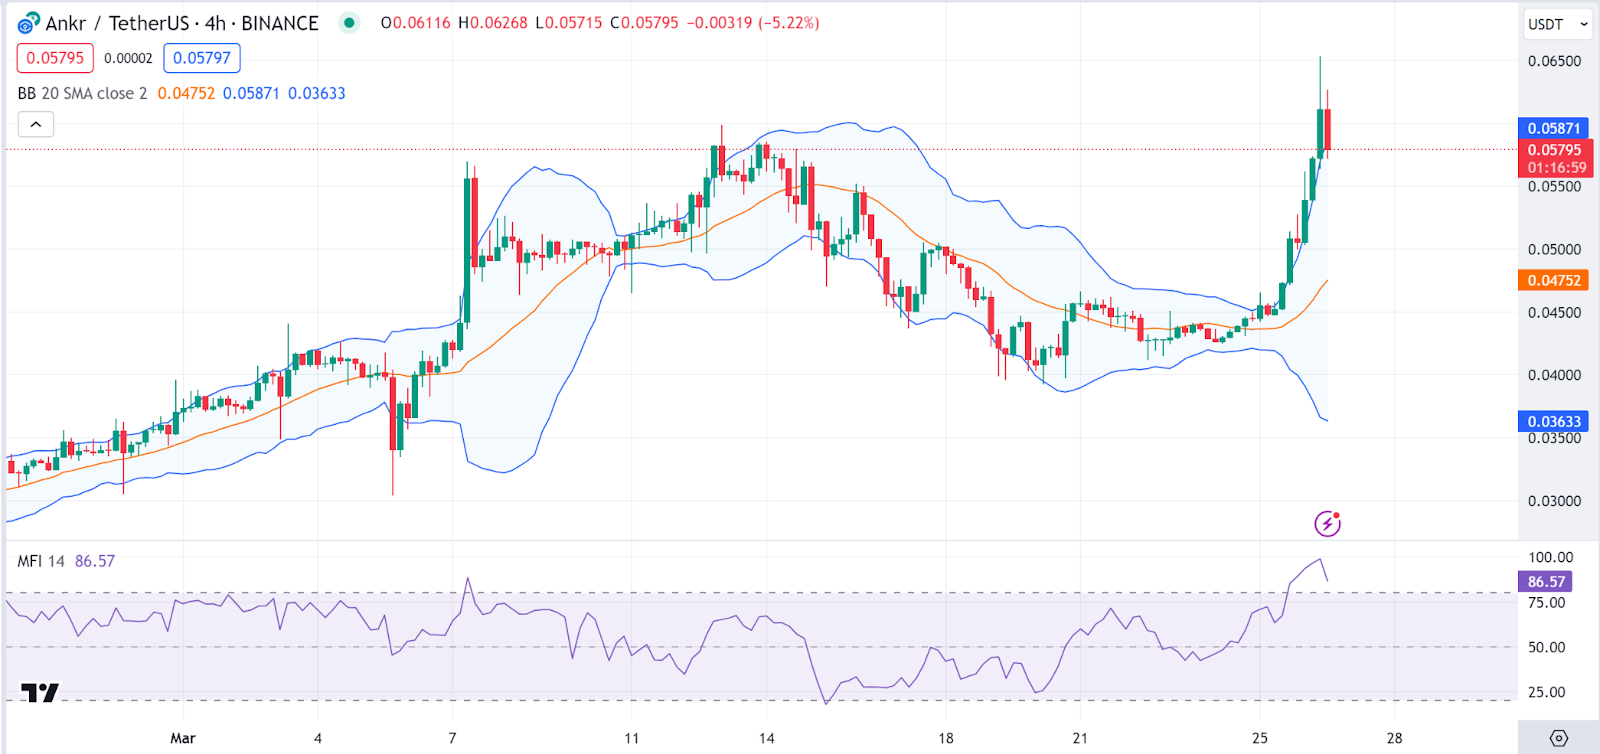
Ankr is among the top gainers today, posting notable gains amid the bull market. Analyzing the Ankr charts, we notice that the Ankr price has recently shot up, touching the upper Bollinger Band, which could signify overextension in the Ankr price movement.
The Money Flow Index (MFI) is very high, close to 90, indicating that the asset might be overbought. Overbought conditions could mean looming corrections on the token, which could already unfold, as evidenced by the MFI’s current southern trajectory. The Ankr price stood at $0.05811 as of press time representing a 24.3% pump over the last 24 hours.
Dogwifhat Price Review
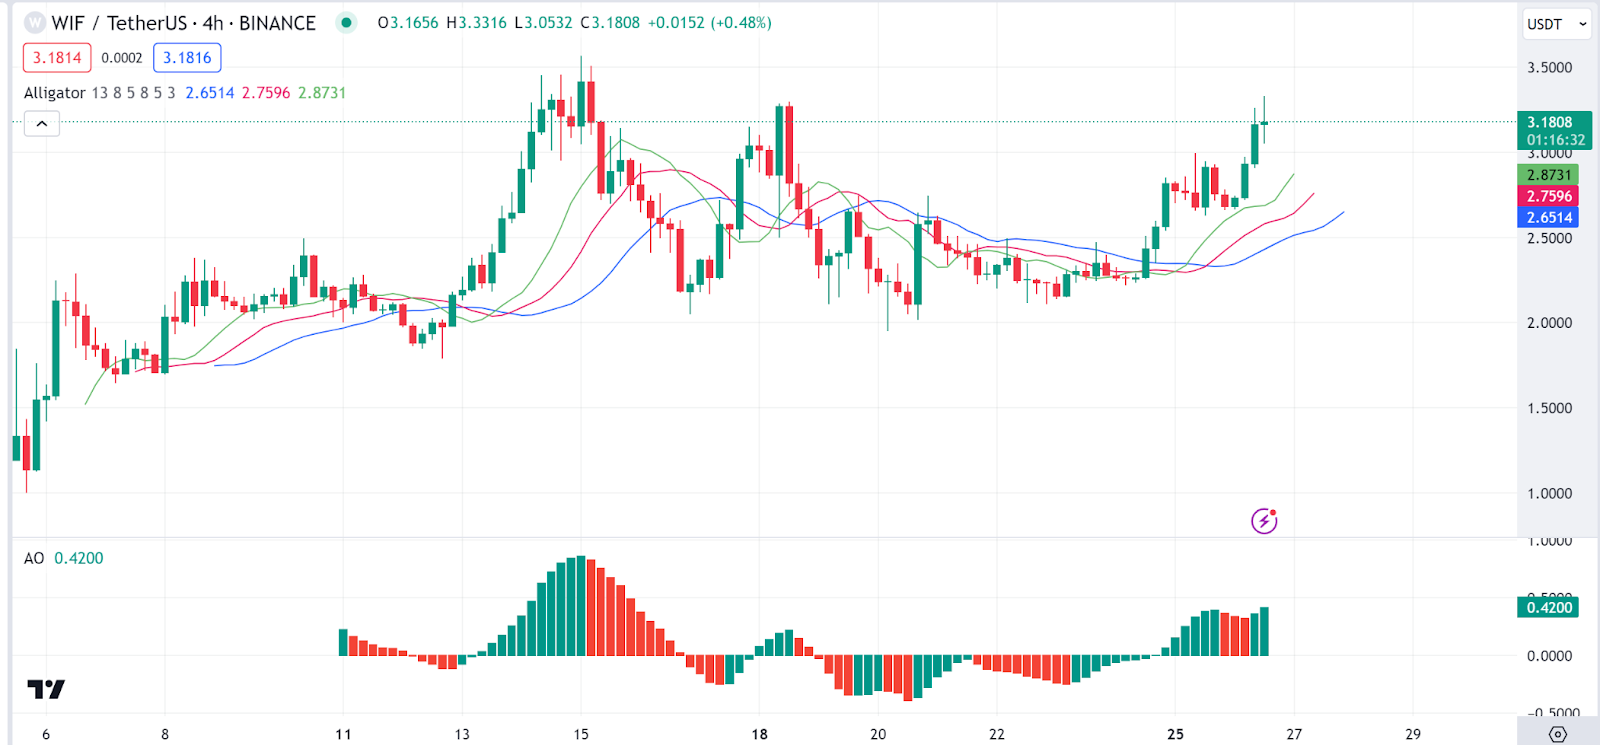
Dogwifhat (WIF) has also made notable gains as meme coins have thrived in today’s market. Analyzing the Dogwifhat price chart, we notice the Alligator’s lines are starting to spread apart with the green line (lips) above the others, suggesting a potential beginning of a bullish trend.
The Awesome Oscillator (AO), also used in gauging trends, shows increasing green bars, confirming bullish momentum. The Dogwifhat price stood at $3.19 as of press time representing a 14.5% pump over the last 24 hours.
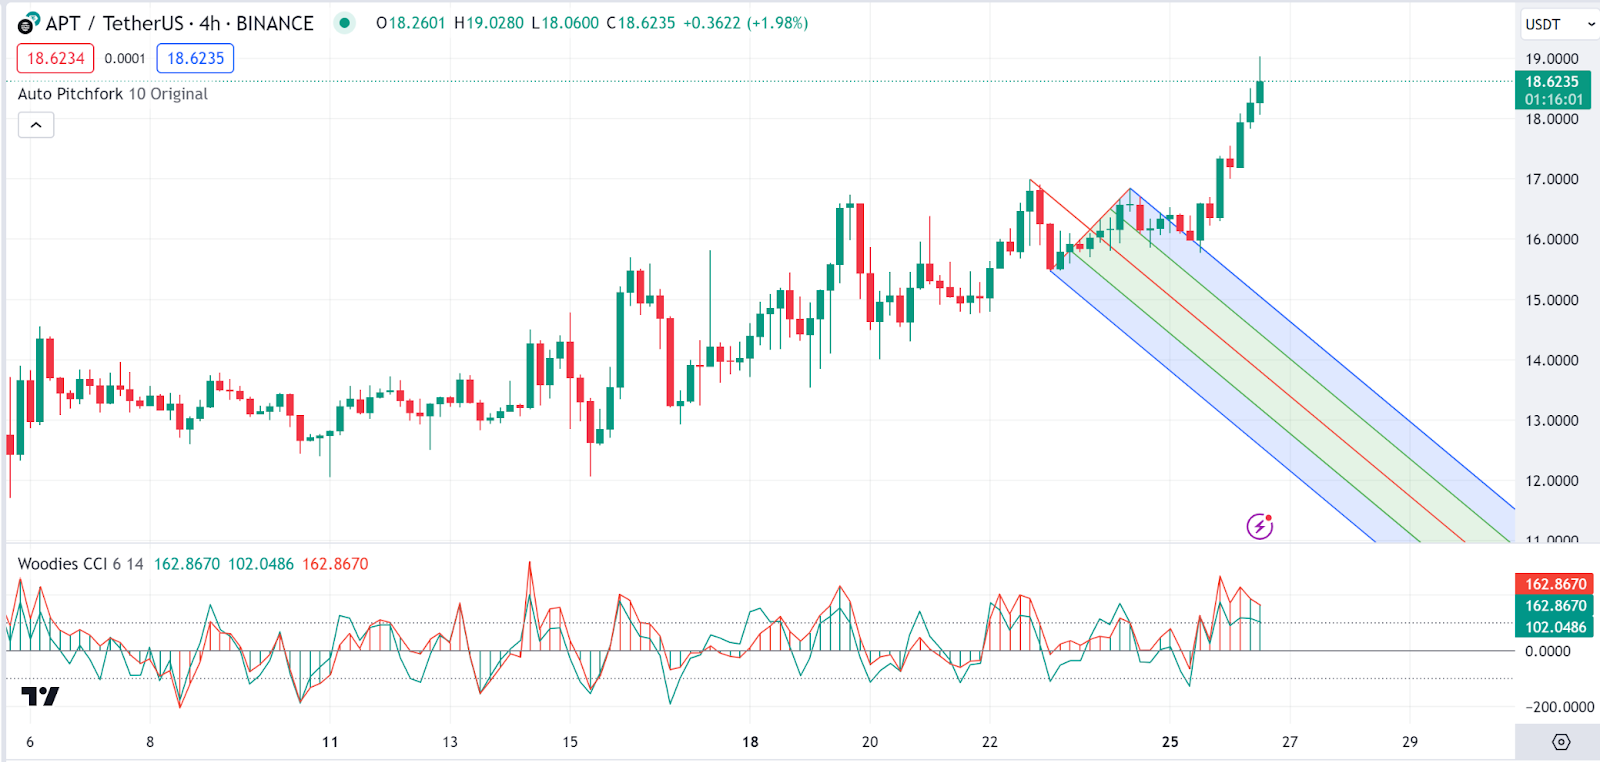
Aptos Price Review
Aptos is also another notable gainer today as it also posted notable gains. Analysing Aptos price charts, we notice it is moving at the upper extreme of the pitchfork, suggesting it might encounter resistance soon.
On the other hand, the Commodity Channel Index (CCI) is showing high readings, indicating the price might be overbought and due for a correction. The Aptos price stood at $18.63 as of press time representing a 15.8% pump over the last 24 hours.
1M ago•
bullish:
0
bearish:
0
Share

 Manage all your crypto, NFT and DeFi from one place
Securely connect the portfolio you’re using to start.

bullish:
0
bearish:
0

bullish:
2
bearish:
0

bullish:
4
bearish:
0
