
Hyperliquid Price Prediction: Can HYPE Hold This Critical Support?

0
0

HYPERLIQUID PRICE PREDICTION just had one of those days where the chart and the headlines are pulling in different directions.
A wallet tied to A16z reportedly offloaded a large chunk of HYPE tokens, the kind of news that usually sends a coin straight through its nearest support. But that's not quite what happened here.
Instead, price found its footing at a level that's been quietly building for days, and how HYPE handles this next stretch could decide whether today's scare turns into a real breakdown or just another shakeout before the next leg up.
Hyperliquid Price Right Now
| Metric | Value |
| Price | $58.86 |
| 24h Change | -2.97% (-$1.8017) |
| Market Cap | $14.88B |
| Futures Volume (24h) | $1.67B |
| Spot Volume (24h) | $137.67M |
| Open Interest | $2.52B |
| Circulating Supply | 252.88M HYPE |
| Total Supply | 953.21M HYPE |
| Max Supply | 953.21M HYPE |
Source: CoinGlass HYPE data; price cross-checked on CoinStats, as of 18 July 2026.
Hyperliquid News Today: Did A16z Just Sell HYPE?
According to a post from BSCN on X, citing Wu Blockchain, a wallet suspected to be linked to A16z sold 105,400 HYPE tokens for around $6.48 million. 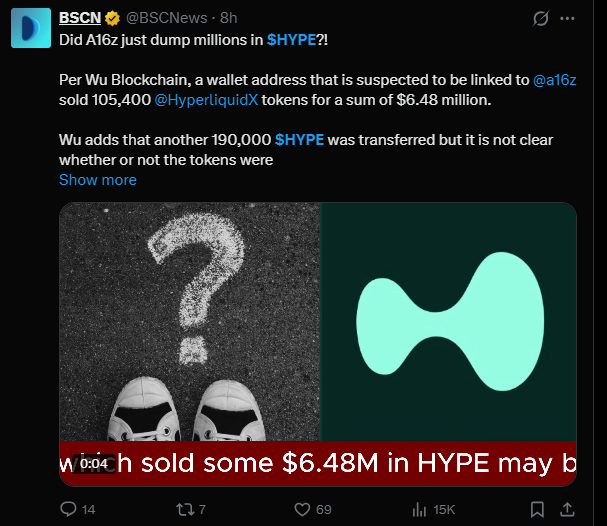
The same report notes another 190,000 HYPE were moved from that wallet, though it isn't yet confirmed whether those tokens were also sold or simply transferred elsewhere.
This kind of headline tends to trigger short-term fear, and it lines up with today's pullback. But a single large wallet selling doesn't automatically mean the broader trend has turned.
Moves like this have historically been followed by other large holders quietly accumulating the dip, which is one reason today's weakness could end up being temporary rather than the start of a deeper breakdown.
For more on how this ties into the wider selloff, see our HYPE support test amid whale selloff
Why Are Bitcoin, Ethereum, and HYPE Down Today?
HYPE isn't falling in isolation. Bitcoin and Ethereum have both seen pressure alongside broader risk-off sentiment this week, and altcoins like HYPE typically move with more volatility in either direction when the two largest coins wobble.
We cover the fuller picture in why Bitcoin, Ethereum, and Hyperliquid prices are down today, but the short version is that this looks like a market-wide risk-off move with the A16z-linked sale adding extra HYPE-specific pressure on top.
Hyperliquid Liquidation Data
CoinGlass liquidation data shows pressure building across every timeframe, with shorts taking the bigger share in the shortest window and longs bearing most of the damage as the window widens. 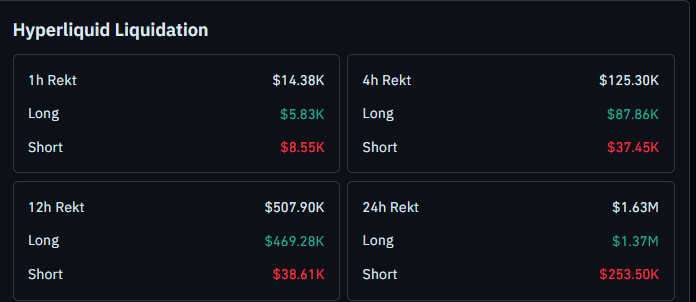
Over the past hour, $14.38K was liquidated, split between $5.83K in longs and $8.55K in shorts.
The 4-hour window shows $125.30K in total liquidations, made up of $87.86K in longs and $37.45K in shorts. Over 12 hours, that number rises to $507.90K, with $469.28K coming from longs and $38.61K from shorts.
Across the full 24 hours, liquidations hit $1.63M, with longs accounting for $1.37M and shorts for $253.50K.
The heavy, long liquidations over the day confirm that today's drop, sharpened by the whale-selling headline, caught a large number of leveraged buyers off guard.
Hyperliquid ETF Flows: What the Data Shows and Where It's Limited
According to SoSoValue's HYPE spot ETF tracker, HYPE spot ETF products saw a net outflow of $7.26M in the week of 17 July 2026, bringing cumulative net inflows down to $301.34M. 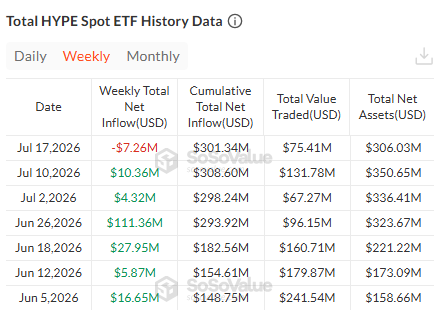
That follows a $10.36M inflow the prior week (10 July, cumulative $308.60M) and a smaller $4.32M inflow the week before that (2 July, cumulative $298.24M).
This data is useful context, but it has real limits.
Weekly ETF flows are a lagging signal; they show what happened last week, not today, and one outflow week combined with a headline-driven wallet sale doesn't necessarily mark a trend reversal.
Treat this as background on institutional positioning rather than a standalone reason to expect a specific move.
Hyperliquid Price Prediction: 4-Hour Chart Analysis
Methodology note: This reading is based on the 4-hour HYPE/USDT chart on Bitget via TradingView, using price structure alongside RSI for momentum. Levels are only considered invalidated on a confirmed candle close beyond the stated price, not an intraday wick.
On the 4-hour timeframe, HYPE built a series of higher lows, climbing from the low $52.637 through a run of higher highs before running into a liquidity grab near $69.027, where price swept above a prior high before reversing.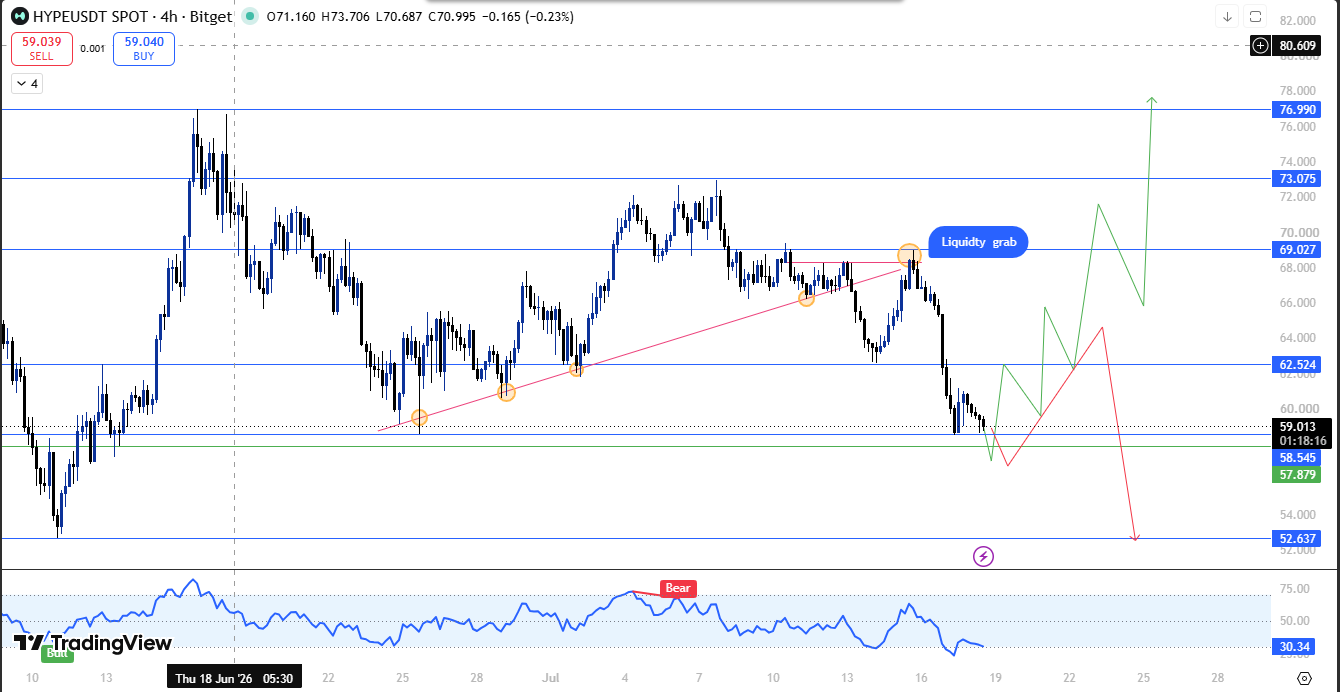
After that reversal, and now compounded by today's whale-selling headline, HYPE pulled back and is sustaining just above $57.879.
This level is the 0.786 Fib retracement of the recent swing higher, a level traders commonly watch since price has a habit of finding buyers there before either continuing its recovery or breaking down for good.
For a similar recovery structure on HYPE, see our U-shape recovery breakdown.
RSI on the 4-hour chart currently reads 30.34, close to oversold territory after cooling off from a bearish reading earlier in the move.
A reading this low, combined with price holding above the 0.786 retracement despite fresh selling pressure, supports the idea that a bounce is possible from here rather than an immediate continuation lower.
If HYPE holds the $57.879 area, the next levels to watch on the upside are $62.524, followed by $69.027, and then $73.075 and $76.990 further out.
On the downside, if the price breaks the $57.879 area, it might go straight through $52.637 and close below it; that would invalidate the current setup and confirm this pullback has turned into something bigger.
Quantified Risk and Reward
From the current price of $59.013, the first upside target at $62.524 represents roughly 6.2% of potential gain, while $69.027 represents close to 17.6%, and $76.990 works out to around 30.8%.
On the downside, the invalidation level at $52.637 sits about 10.6% below the current price, giving a rough sense of how the reward compares to the risk on this setup.
Hyperliquid Technical Snapshot
| Indicator | Signal |
| Trend | Higher highs on the 4H, now retracing on wholesale news |
| RSI | 30.34, near oversold |
| Structure | Holding the 0.786 Fib retracement zone |
| Liquidations | Longs absorbing most of the 24-hour damage |
| ETF Flows | Latest week negative, prior weeks positive |
Hyperliquid Price Prediction: Key Support and Resistance Levels
| Type | Level | Note |
| Resistance 3 | $76.990 | Extended upside target |
| Resistance 2 | $73.075 | Secondary resistance |
| Resistance 1 | $69.027 | Prior liquidity grab zone |
| Immediate Resistance | $62.524 | First target if the retracement zone holds |
| Current Price | $58.86 | Sitting just above the 0.786 Fib zone |
| Fib Retracement Zone | $57.879 | 0.786 retracement of the recent swing |
| Last Support | $52.637 | Invalidation trigger on a confirmed close below |
Risk-Reward Table
| Case | Trigger | Target |
| Bull Case | Holds the $57.879 Fib zone despite the wholesale headline | Move toward $62.524, then $69.027 |
| Bear Case | Breaks and closes below $52.637 | Structure invalidated, deeper downside opens up |
Invalidation Level
This bullish read on HYPE depends on the $57.879 zone holding as support. A confirmed 4-hour close below $52.637 breaks that thesis entirely.
Beyond the chart, HYPE tends to move with broader risk sentiment, and a continuation of large-wallet selling similar to today's A16z-linked news could pressure this setup even if the chart structure stays technically intact.
Historical Context
The current pullback follows a genuine higher-high structure on the 4-hour chart, not just a single spike.
HYPE built several consecutive higher lows before the liquidity grab near $69.027, generally read as a sign buyers were in control through most of that leg up.
Large-wallet selloffs like today's have shown up before during HYPE's climb, and in several of those past instances, other holders used the dip to accumulate rather than the selling triggering a full trend reversal.
How price behaves at this 0.786 retracement will say a lot about whether that pattern repeats itself.
Short-Term, Mid-Term, and Long-Term Outlook
Short-term: This entire chart read is based on the 4-hour timeframe as of 18 July 2026 and should be treated as a short-term view given the fresh whale-selling news. It should be rechecked if the price closes decisively through either $58.545 or $52.637. For today's full setup, see the Hyperliquid price prediction today.
Mid-term (2026-2027): Beyond this week's chart structure, HYPE's mid-term path leans on whether institutional flows recover from this week's outflow and whether whale accumulation follows this selloff the way it has in past dips. See our broader 2026 outlook and 2027 outlook
Long-term (2029): For readers thinking beyond the next few quarters, our 2029 Hyperliquid price prediction and HYPE price prediction 2026 walk through the longer-horizon scenarios in more depth.
Hyperliquid Glossary
-
Higher High: A price structure where each new peak in an uptrend is higher than the one before it, generally read as a sign of ongoing buyer control.
-
Fib Retracement: A tool that measures how far price has pulled back from a prior move, with the 0.786 level marking a deep retracement some traders watch for a potential reaction.
-
Liquidity Grab: A move where price briefly pushes past a prior high or low, often triggering stop orders, before reversing direction.
-
RSI (Relative Strength Index): A momentum indicator used to judge whether an asset has moved too far too fast, flagging overbought or oversold conditions.
-
Open Interest: The total value of derivative contracts, like futures, that remain open and unsettled.
-
Liquidation: The forced closing of a leveraged position once losses use up all of a trader's margin.
-
Whale Selloff: A large, concentrated sale of tokens by a single large holder, often causing short-term price pressure independent of the broader trend.
Expert View
HYPE's pullback to the $57.879 to $58.545 zone lines up with a textbook 0.786 Fib retracement of its recent higher-high move, and the fact that RSI has cooled to 30.34 without price breaking down, even after today's A16z-linked selling headline, adds some weight to the idea that buyers could step back in from here.
The heavier long liquidations over the past 24 hours suggest this drop already flushed out a good share of over-leveraged positions, which can sometimes clear the way for a cleaner bounce once the initial fear fades.
That said, the latest week of ETF outflows and the fresh whale sale are reminders that institutional and large-holder positioning hasn't fully confirmed this recovery yet.
A confirmed close below $52.637 would be the clearest sign that sellers, not just short-term fear, have taken control.
Disclaimer: This article is for informational purposes only and should not be considered financial advice. Cryptocurrency markets are highly volatile, and price predictions are not guaranteed. Please do your own research before making any investment decisions.
0
0

 Manage all your crypto, NFT and DeFi from one place
Securely connect the portfolio you’re using to start.

0
0

0
0

0
0

0
0