
PEPE Price Prediction 2026: Wedge Breakout or Bull Trap in Disguise?

0
0

A green wedge breakout doesn't always mean a smooth ride, and PEPE traders got a reminder of that this week. Something shifted overnight that pulled a lot of confident positions apart at once. The bigger question is whether this is just noise inside a longer climb or the first crack in a pattern that looked unstoppable a few days ago.
Is PEPE's Falling Wedge Breakout Already Losing Steam?
PEPE price prediction searches are climbing again, and this time it's not pure hype driving it. The frog coin just pulled back hard after weeks of grinding higher inside a textbook-looking recovery pattern. Traders who'd piled into long positions got caught off guard.
Here's the thing: pullbacks inside a bigger uptrend look scary in the moment. But they don't automatically break the structure that built them.
So is this dip a gift, or the start of something worse? Let's look at what the chart and the wallets are actually saying.
Table of Contents
Key Takeaways
Token Contract
Where PEPE Stands Right Now
What's Driving PEPE's Price Today
Technical Analysis: 4-Hour Chart
Technical Analysis: Monthly Chart
The Long Liquidation Flush
Tokenomics and Holder Concentration
Liquidity and Exchange Volume
Bull, Base, and Bear Scenarios
Price Forecast Table
What to Watch Next
Key Risks
Glossary
Key Takeaways
PEPE trades near $0.0000028 as of the latest snapshot, down 6.45% over 24 hours, per CoinMarketCap's PEPE page.
The 4-hour RSI sits at 44.83, cooling from overbought levels seen days ago. And the monthly RSI reads 42.81, still under the neutral 50 line despite a 21.03% gain this month.
Liquidations hit $776.98K over 24 hours, and longs took $674.74K of that. Almost all of today's pain landed on buyers, not sellers.
The top 100 wallets hold 77.19% of the tracked value. A tiny slice of holders, just 0.09%, control 88.87% of market cap. That's concentration worth watching.
Token Contract
Contract Address: 0x6982508145454Ce325dDbE47a25d4ec3D2311933
Standard: ERC-20
Security Rating: CertiK 4.4 / 5
Where PEPE Stands Right Now
PEPE last changed hands around $0.0000028, down 6.45% on the day. The 24-hour range ran from a low near $0.00000277 to a high of $0.00000302, a range confirmed on CoinMarketCap's live PEPE tracker.
Market cap sits near $1.16 billion against a 24-hour volume of $223.69M. That's a vol-to-market-cap ratio just above 19%. Liquidity relative to market cap reads 1.98%, thinner than some rival meme tokens.
Total and circulating supply both sit at roughly 413.77 trillion PEPE, meaning there's no meaningful unlock overhang left to worry about. Etherscan's token page lists max supply slightly higher, at 420.69 trillion, so anyone sizing a position should check both sources.
The all-time high, $0.00002825, was set two years ago. Current price sits 90.04% below that peak. The all-time low, near $0.0000001063, was set three years back, and PEPE now trades over 26 million percent above that floor in raw terms, though that figure means less than it sounds given how far the token has fallen from its high.
What's Driving PEPE's Price Today
There's no single headline behind today's drop. Broader meme coin sentiment cooled across the board this week, and PEPE simply moved with it.
That cooling landed right as PEPE approached a key resistance zone on the shorter timeframe, the kind of level that tends to invite profit-taking regardless of the wider trend, a pattern also visible in recent PEPE burn rally coverage.
Add in a wave of forced long liquidations, and the drop got sharper than the underlying sentiment shift alone would explain.
Technical Analysis: 4-Hour Chart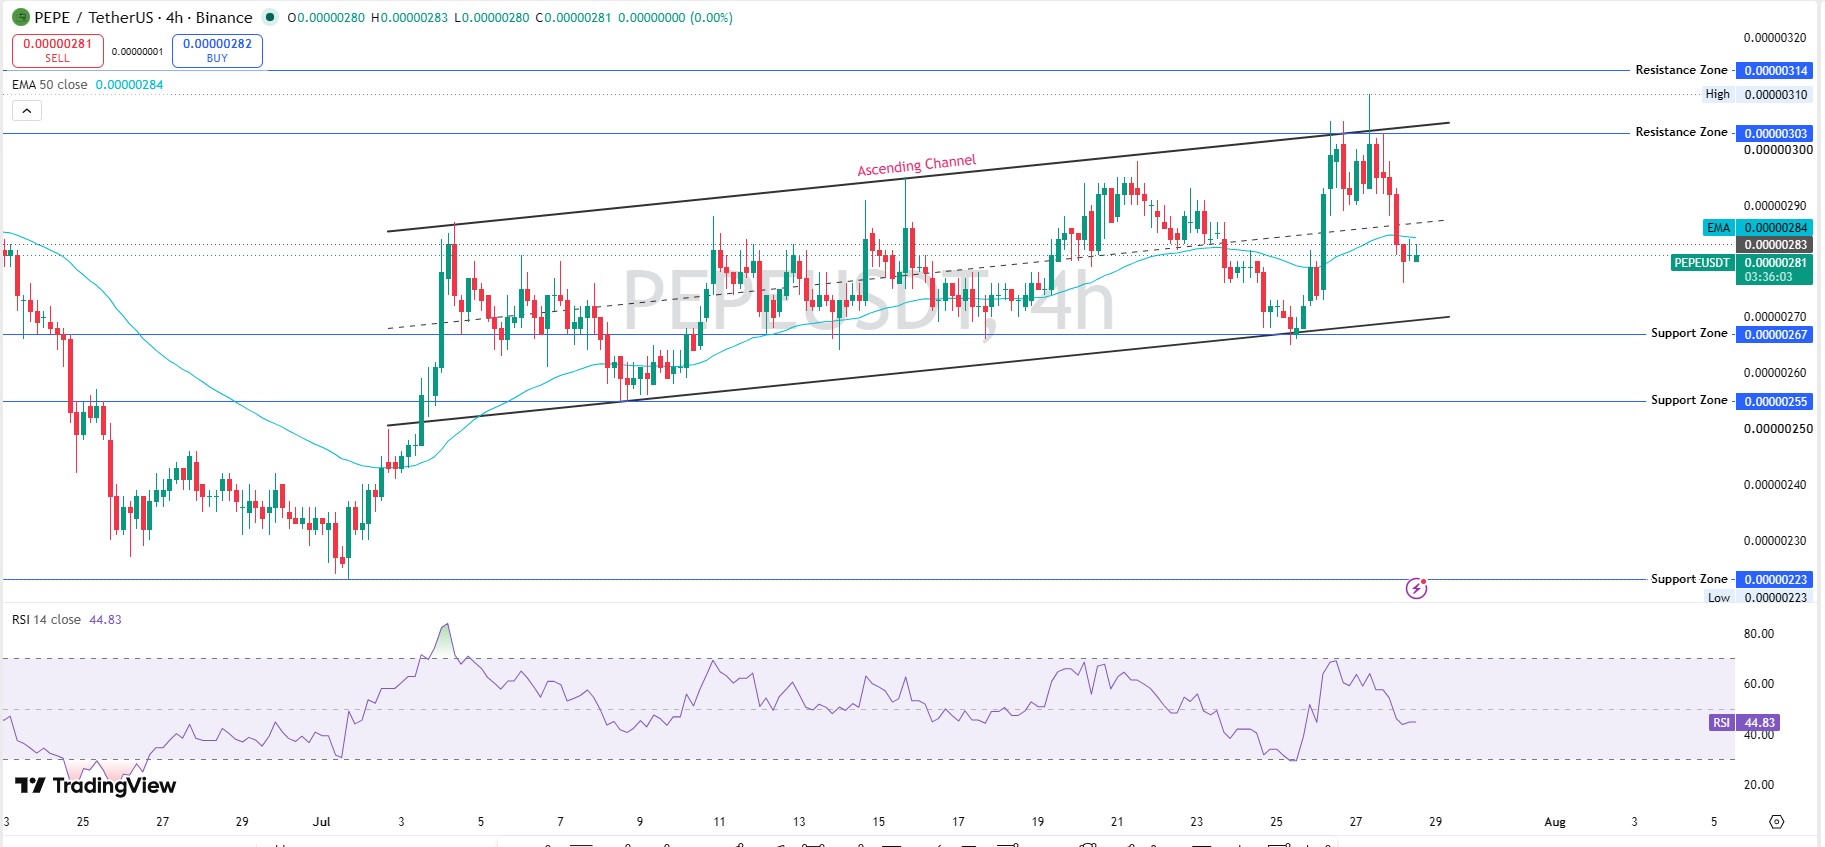
On the 4-hour PEPE/USDT chart, price built a clean ascending channel through most of July before rolling over near the top of that structure. The 50-period EMA sits at $0.00000284, just above the current price, showing the short-term trend has flattened rather than broken.
RSI on this timeframe reads 44.83. That's neutral, not oversold, which tells us the drop hasn't panicked the market yet.
Resistance sits at $0.00000303, then a firmer wall at $0.00000314. Support sits at $0.00000267, backed by $0.00000255, with a deeper floor near $0.00000223.
Support and Resistance Snapshot (4H)
Level | Price |
Resistance 2 | $0.00000314 |
Resistance 1 | $0.00000303 |
Current Price | $0.00000281 |
Support 1 | $0.00000267 |
Support 2 | $0.00000255 |
Support 3 | $0.00000223 |
Technical Analysis: Monthly Chart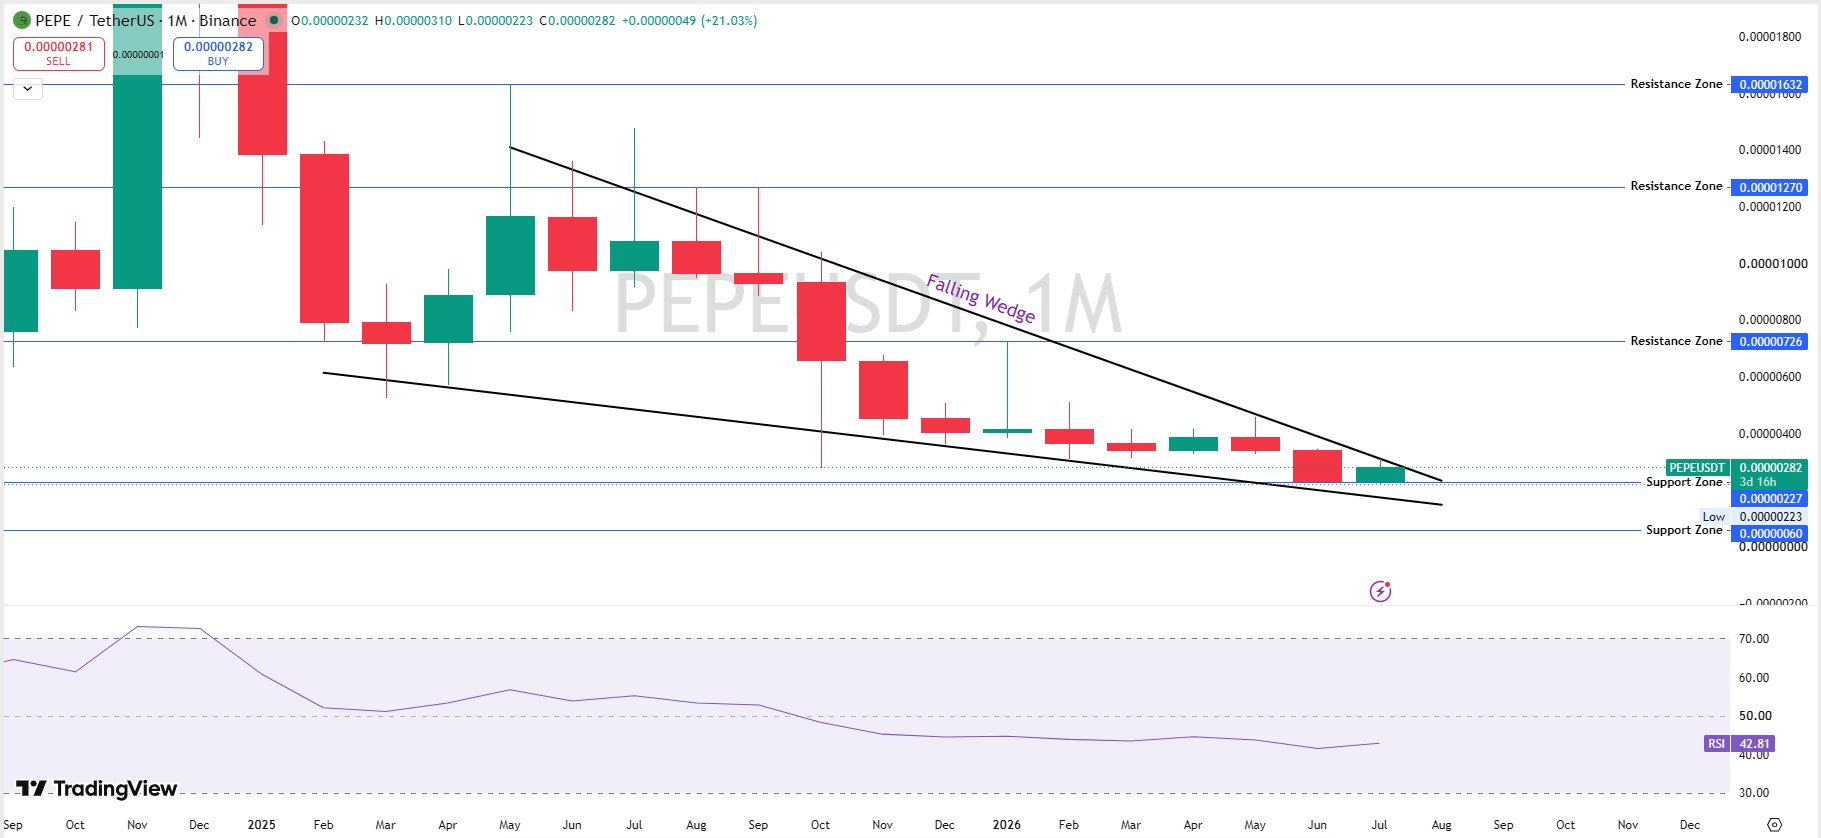
Zoom out, and the picture reads differently. PEPE broke out of a falling wedge that had held since late 2024, a structure tracked in our PEPE 2027 outlook. This month's candle is up 21.03%.
Monthly RSI reads 42.81, still under the 50 midline even after that gain. That gap between price action and momentum is the real tension in this chart.
Above the price, resistance sits at $0.00000726, then $0.00001270, then $0.00001632. Below, support holds at $0.00000227, with a deeper floor near $0.00000060 if the wedge breakout fails completely.
Support and Resistance Snapshot (Monthly)
Level | Price |
Resistance 3 | $0.00001632 |
Resistance 2 | $0.00001270 |
Resistance 1 | $0.00000726 |
Current Price | $0.00000282 |
Support 1 | $0.00000227 |
Support 2 | $0.00000060 |
The Long Liquidation Flush
Liquidation data tells a clear story here, one visible on the Coinglass PEPE liquidation tracker. Over the past hour, $20.46K got liquidated, and every bit of it hit longs. Zero shorts touched.
Four hours out, total liquidations reached $21.31K, again almost entirely long positions.
Twelve hours in, the number jumps to $463.25K, with longs eating $442.13K of that. Twenty-four hours, and the total climbs to $776.98K, with longs still carrying $674.74K of the pain.
That's not a squeeze. That's a flush. Buyers who leaned in near the top of the channel got caught leaning the wrong way.
Liquidation Snapshot
Window | Total | Long | Short |
1h | $20.46K | $20.46K | $0 |
4h | $21.31K | $20.46K | $847.01 |
12h | $463.25K | $442.13K | $21.12K |
24h | $776.98K | $674.74K | $102.23K |
Tokenomics and Holder Concentration
PEPE's contract is an ERC-20 token rated 4.4 out of 5 by CertiK, with full holder detail visible on Etherscan's holder analytics page. Total holders sit at 570,678.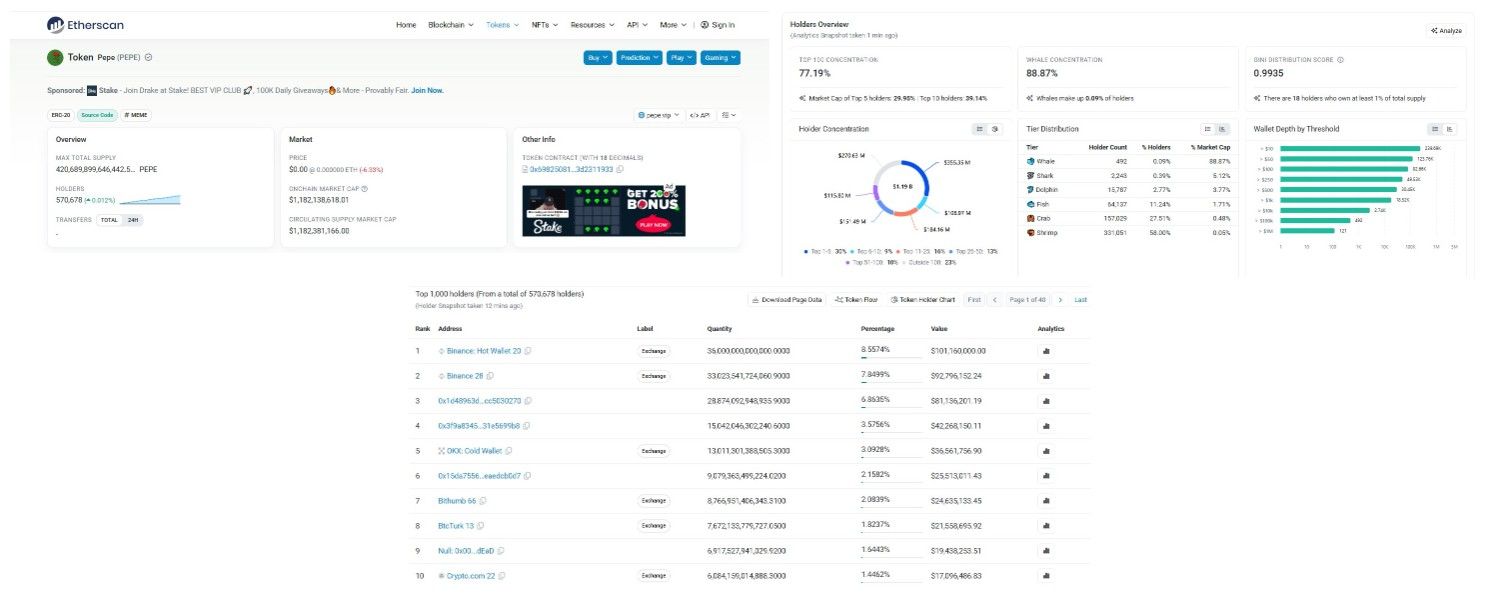
Concentration is real. The top 100 wallets hold 77.19% of the tracked market cap. Just 492 wallets, 0.09% of all holders, control 88.87% of that value. The Gini score reads 0.9935, near maximum inequality, and 18 wallets each hold at least 1% of total supply.
But context matters here. The top ten addresses lean heavily toward exchange custody rather than lone whales. Binance Hot Wallet 20 leads at 8.56%, followed by a second Binance wallet at 7.85%, an unlabeled address at 6.86%, and further down, OKX's cold wallet, Bithumb, BtcTurk, and Crypto.com all show up, alongside a burn address holding 1.64%.
Holder Tier Breakdown
Tier | Holder Count | % Holders | % Market Cap |
Whale | 492 | 0.09% | 88.87% |
Shark | 2,243 | 0.39% | 5.12% |
Dolphin | 15,787 | 2.77% | 3.77% |
Fish | 64,137 | 11.24% | 1.71% |
Crab | 157,029 | 27.51% | 0.48% |
Shrimp | 331,051 | 58.00% | 0.05% |
Liquidity and Exchange Volume
Liquidity against market cap sits at 1.98%, thinner than some comparable tokens, meaning larger orders can move price faster than they would elsewhere.
Futures volume spreads across several venues rather than one dominant exchange. MEXC leads at $148.33M, with OKX close behind at $112.63M, then LBank, Bitget, KuCoin, Gate, and Bitunix trailing.
That spread cuts both ways. It reduces single-venue risk, but it also means no one order book fully reflects true depth, a dynamic worth weighing alongside broader crypto exchange listing coverage.
Bull, Base, and Bear Scenarios
None of this is financial advice. These are scenario ranges built from current chart structure, not promises, and they sit alongside our wider crypto price prediction hub for context.
Bull Case: A daily close above $0.00000303 opens a path toward $0.00000314 within 7 to 14 days. Probability near 30%, tied to the monthly RSI clearing 50. Invalidation: a daily close below $0.0000026.
Base Case: Price ranges between $0.0000026 and $0.0000030 over the next 7 to 30 days while the wedge breakout gets retested. The probability is highest, near 45%. Invalidation: a clean weekly close outside either edge.
Bear Case: Momentum fades further, and price slides back toward $0.00000255, with $0.00000223 in range within 30 days if sentiment sours. Probability near 25%. Invalidation: sustained volume holding above $0.0000029 for over a week.
Price Forecast Table
Timeframe | Bear | Base | Bull |
24H | $0.0000027 | $0.0000028 | $0.0000030 |
7D | $0.0000024 | $0.0000029 | $0.0000032 |
30D | $0.0000020 | $0.0000031 | $0.0000045 |
Long Term | $0.0000010 | $0.0000050 | $0.0000150 |
What to Watch Next
Every PEPE price prediction for the August 2026 outlook comes down to a handful of levels, not vibes. Watch whether price holds above $0.0000026 through the first week of August. That's the line separating a healthy retest from a failed breakout.
Monthly RSI clearing 50 matters more than any single daily candle. It's the one signal that would confirm the wedge breakout has real legs heading into August, rather than fading back into the same range PEPE spent 2025 stuck in.
Here's the thing: liquidation data resets fast. A quiet 24 hours with no long flush would suggest the worst of this week's forced selling is behind us. Another spike, and the base case range shifts lower.
Keep an eye on futures volume concentration too. If MEXC and OKX volume keeps climbing relative to spot, that's leverage doing the driving again, not organic demand, a pattern also worth tracking against broader Bitcoin price forecast coverage.
For anyone building a PEPE price prediction for August 2026 view of their own, the short list is simple: hold above $0.0000026, RSI above 50, and no fresh long liquidation spike. Two out of three would keep the bullish case alive. All three failing points toward the bearish case instead.
Key Risks
Distance from the all-time high is a reminder that PEPE remains deep in a multi-year drawdown, and any bounce should get read against that backdrop, not in isolation from our Bitcoin price prediction 2026 coverage.
Holder concentration remains extreme even after accounting for exchange wallets. Thin liquidity relative to market cap means sharp moves in either direction stay likely. And meme coin sentiment can flip fast, often tracking broader risk appetite discussed in our Ethereum price prediction 2026 piece more than any PEPE-specific news.
Glossary
RSI: A 0-100 momentum indicator. Above 70 usually signals overbought; below 30 signals oversold.
EMA: A trend-following average, weighting recent prices more heavily than older ones.
Falling Wedge: A narrowing chart pattern that often precedes an upward breakout.
Liquidation: The forced closing of a leveraged position once losses exceed available margin.
Gini Score: A measure of distribution inequality, from 0 to 1.
FDV: What market cap would there be if every token that would ever exist were already circulating?
Disclaimer: This article is for informational purposes only and does not constitute financial advice. Cryptocurrency markets are highly volatile. Always do your own research, and check our coin events calendar and crypto airdrops tracker before making decisions.
0
0

 Manage all your crypto, NFT and DeFi from one place
Securely connect the portfolio you’re using to start.

0
0

0
0

0
0

0
0