Crypto Market Price Analysis Today: Bitcoin (BTC), Ethereum (ETH), Polymesh (POLYX), IOTA, ONDO
1M ago•

bullish:
0
bearish:
0
Share

Bitcoin has kicked off the week on a positive note, aiming to stay above the $70,000 mark. There’s hope among analysts for a market turnaround this week, after a streak of five consecutive days of negative inflows into Bitcoin spot exchange-traded funds (ETFs) was observed last week.
Goldman Sachs has reported a significant interest in its futures and options offerings from clients. Max Minton, the head of digital assets for Goldman Sachs in the Asia Pacific region, mentioned an increased interest in the cryptocurrency sector among the bank’s major clients, especially after the introduction of spot Bitcoin ETFs. The demand for these ETFs is expected to stay robust unless Bitcoin experiences a steep decline. This could result in limited price corrections, as investors are likely to seize opportunities to buy on dips.
Now, let’s dive into the technical analysis to identify critical resistance levels for Bitcoin and other cryptocurrencies.
Bitcoin (BTC) Price Analysis
Bitcoin recently surged above its bearish channel pattern, indicating that bullish momentum is in the lead again. As a result, the *BTC* price surged above the $71K level and is aiming to touch new ATH this week. As of writing, BTC price trades at $70,788, surging over 5.8% from yesterday’s rate.
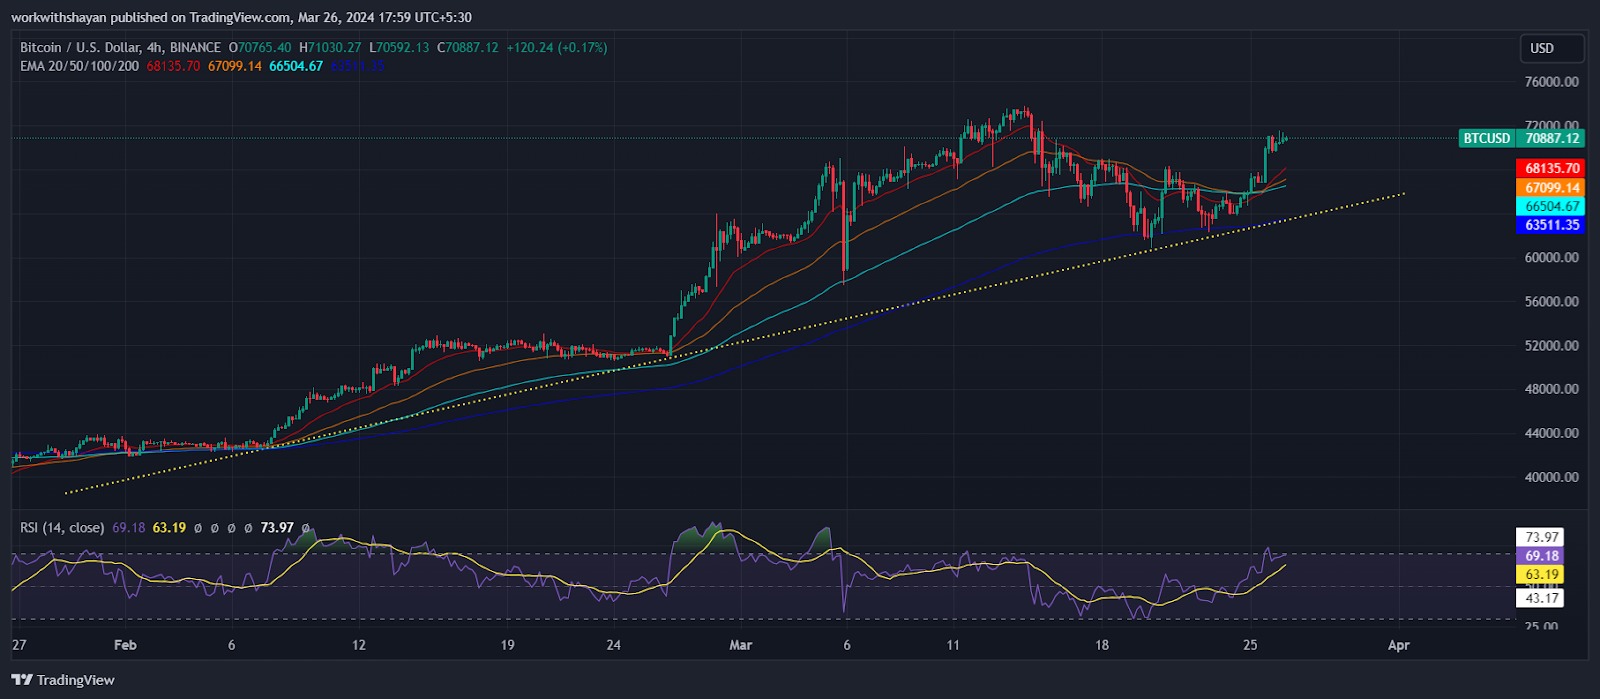
BTC/USD Chart on TradingView
Should this momentum sustain the price over $70,000, it’s anticipated that the BTC/USDT pairing will rise towards its next major resistance at $74K. This point might serve as a critical barrier; however, overcoming it could send the pair towards $80,000.
On the flip side, a decline from its present position could hint at the breakout being a deceptive move by the bulls. The bears will then attempt to drive the price beneath the EMA20 trend line. Succeeding in this could lead to a fall towards the 50-day Simple Moving Average (SMA) at $63K.
The 4-hour chart indicates that bearish forces are limiting any upward corrections around $72K, making it a crucial threshold to monitor. If the price drops toward the ascending support line and buyers fail to defend that level, we might see a steep collapse below $60K.
Ethereum (ETH) Price Analysis
Ether has successfully surpassed the 20-day Exponential Moving Average (EMA) of $3,500, showcasing a strong bullish momentum. Should the *ETH* price remain above this level, it could signal an end to the recent corrective trend. Consequently, the ETH/USDT price may target a rise to $3,900, potentially leading to a surge towards the key resistance level at $4,100.
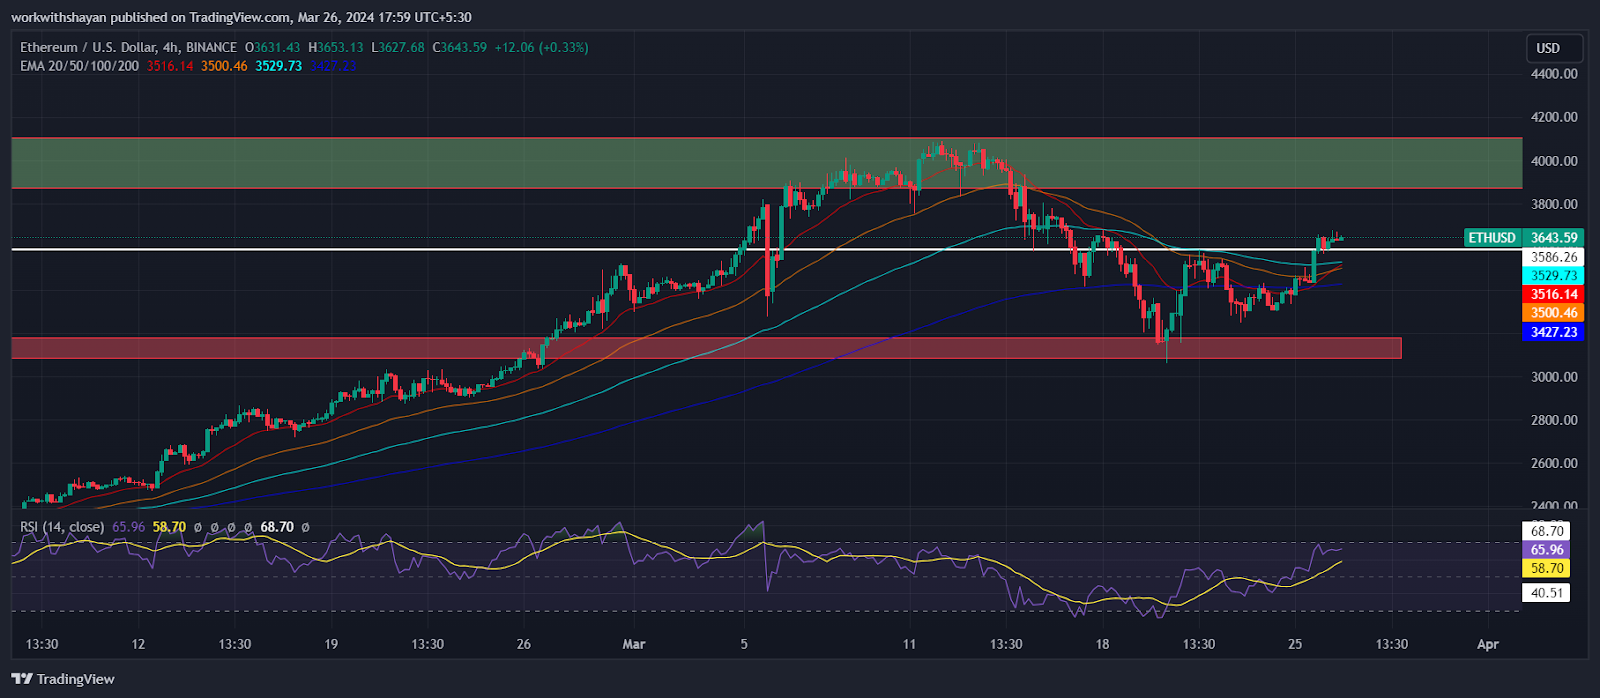
ETH/USD Chart On TradingView
Conversely, this bullish scenario might be negated if the price faces rejection at $3,900 and drops beneath the 20-day Exponential Moving Average (EMA). Such a move would suggest the beginning of a more significant downturn, possibly reaching down to $3.3K level and potentially further to $3,000.
Polymesh (POLYX) Price Analysis
Polymesh’s recent surge has hit a significant obstacle at $0.68, where a strong pushback from sellers was witnessed. However, POLYX price has made breakout momentum in the last 24 hours as it skyrocketed toward resistance channels. Currently, POLYX price trades at $0.62, surging over 40% in the last 24 hours.
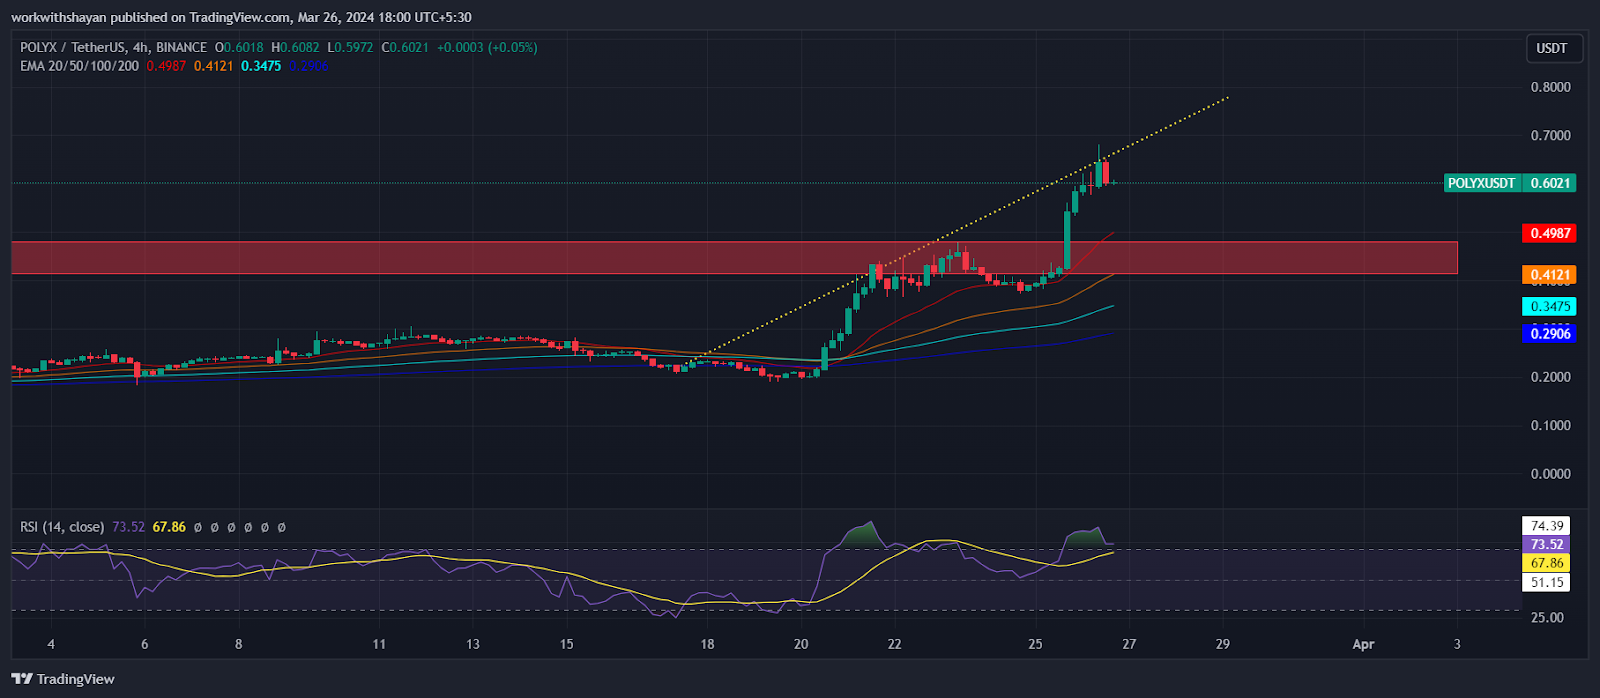
POLYX/USDT Chart On TradingView
The 20-day Exponential Moving Average (EMA) is on an upward trajectory at $0.48, and the Relative Strength Index (RSI) remains in overbought territory, signaling that momentum may be on the side of the buyers.
Should the buying pressure maintain its strength near this level, the chances of breaking through the $0.68 barrier will grow. This could send the POLYX/USDT trading pair towards a new high. However, if the price drops below the $0.45 mark, we might see a surge in selling pressure.
IOTA Price Analysis
IOTA’s price has made its way after rebounding above the 20-day Exponential Moving Average (EMA), priced at $0.33, marking a key resistance level to monitor. Should the price continue to trade above that level, it would indicate that the buying momentum holds. As of writing, IOTA price trades at $0.366, surging over 13% in the last 24 hours.
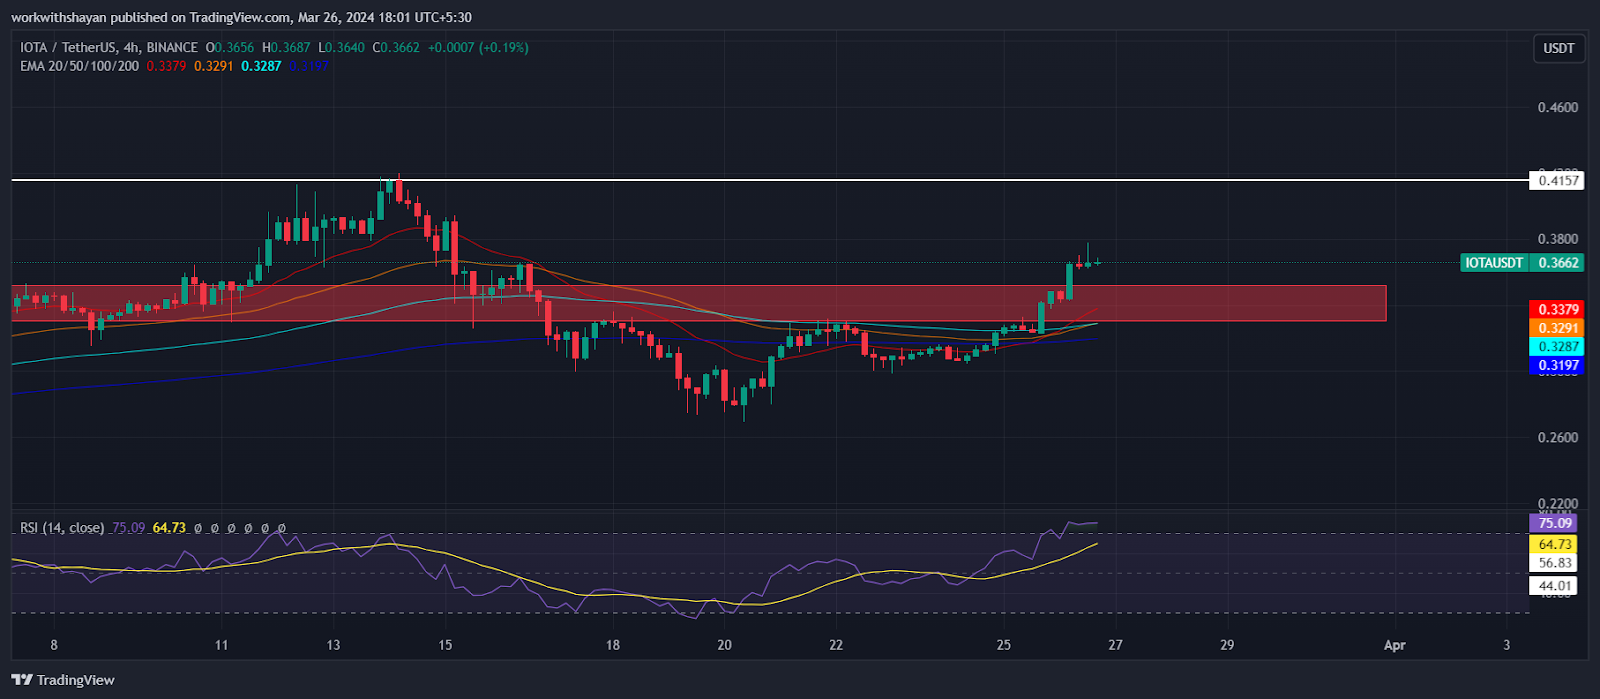
IOTA/USDT Chart On TradingView
If IOTA price fails to hold above the $0.33 mark, we might see a decline toward $0.28. However, this level will be strongly defended by buyers.
On the flip side, a push above $0.41 would imply a resurgence of buying interest, putting the bulls back in control. Following such a move, the pair would aim for the next resistance at $0.5. Successfully overtaking this barrier could pave the way for a further rally towards $0.56.
ONDO Price Analysis
The ONDO price has been continuing to trade within the arc and the range bound zone, suggesting that bears might soon challenge the $0.82 support level to establish a clear trend. Currently, the ONDO price is at $0.91, having increased by over 1.6% in the last 24 hours.
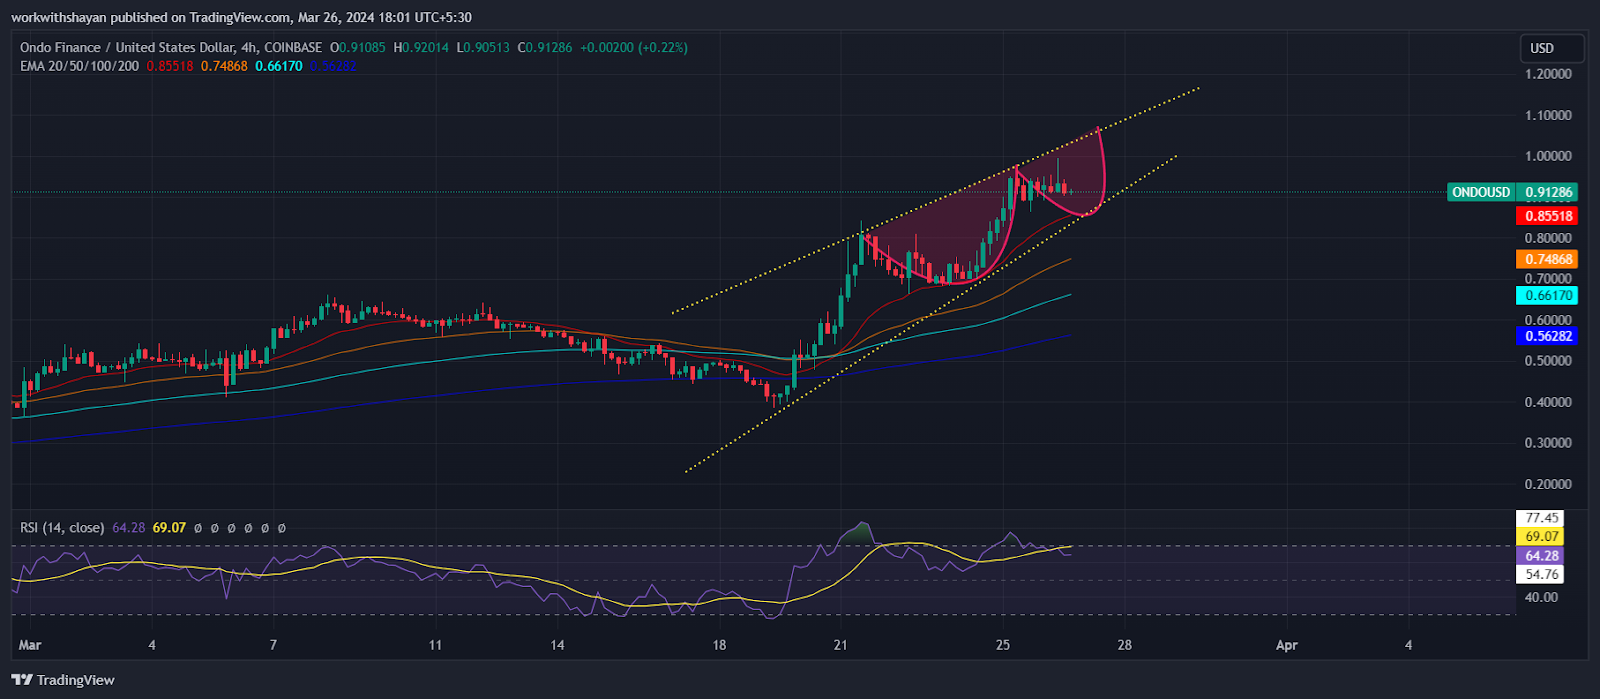
The price attempted to surge above $1; however, the recent pullback from that level implies that sellers are initiating a downward movement. Bears are likely to aim for a further decline by driving the price below the 20-day EMA, aiming for a downturn towards the $0.83 breakout point, which is expected to be a strong focal point for buyer interest.
On the flip side, a surge past the $1.1 threshold could propel the ONDO/USDT pair to new levels.
1M ago•
bullish:
0
bearish:
0
Share


 Manage all your crypto, NFT and DeFi from one place
Securely connect the portfolio you’re using to start.

bullish:
1
bearish:
0

bullish:
0
bearish:
0

bullish:
1
bearish:
0

bullish:
0
bearish:
0