
Chainlink Price Prediction October 2026: LINK-Swift News Eyes $35

0
0

Chainlink Price Prediction October 2026 is suddenly on every trader's radar, and the reason goes beyond one green candle.
LINK has been climbing with real structure behind it, and a big-name headline just landed on top. Here is the daily chart read, using market data available on Sep 29, 2026.
Our editorial desk holds no personal position in LINK. This is purely a chart and data read.
Chainlink Price Today
LINK is priced near $14.788 on the TradingView chart, while the CoinGlass card shows $14.801, up 6.83% over 24 hours.
The two numbers look like they disagree, but they measure different windows. The daily candle opened at $15.451, touched a high of $15.777, and is now down 4.30% from that open. Market cap sits at $11.06B.
Open interest (the total value of unsettled futures contracts) stands at $846.58M. Futures volume over 24 hours is $1.97B against $411.75M in spot volume, so derivatives trading is roughly five times the spot activity. Circulating supply is 748.09M out of a 1.00B maximum.
Source: CoinGlass, Sep 29, 2026.
Chainlink News Today
Chainlink's official X account (@chainlink) posted about 9 hours before this update that it is working to let financial institutions connect to Swift's blockchain ledger through the Chainlink platform.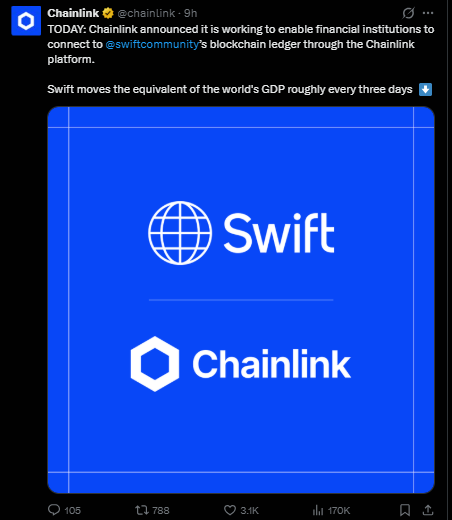
The post pointed out that Swift moves the equivalent of global GDP roughly every three days.
That is a heavyweight name in traditional finance. Still, the wording is "working to enable," so this is a progress signal, not a live product.
Traders tend to price in headlines like this fast, which may explain part of the sharp 24h move.
Source: Chainlink on X, Sep 29, 2026.
Quick Take
CMP: $14.788
Support that keeps LINK bullish: $11.896
Failure level: daily close below $11.896
Data time: Sep 29, 2026, 10:41 UTC+5:30
Risk note: price just rejected the $15.000 area intraday, so the daily close matters.
Chainlink Price Prediction October 2026 Technical Analysis
Methodology: 1D timeframe, Binance exchange, an ascending trendline, marked support and resistance levels, and the chart oscillator label. The invalidation rule is a daily close below $11.896.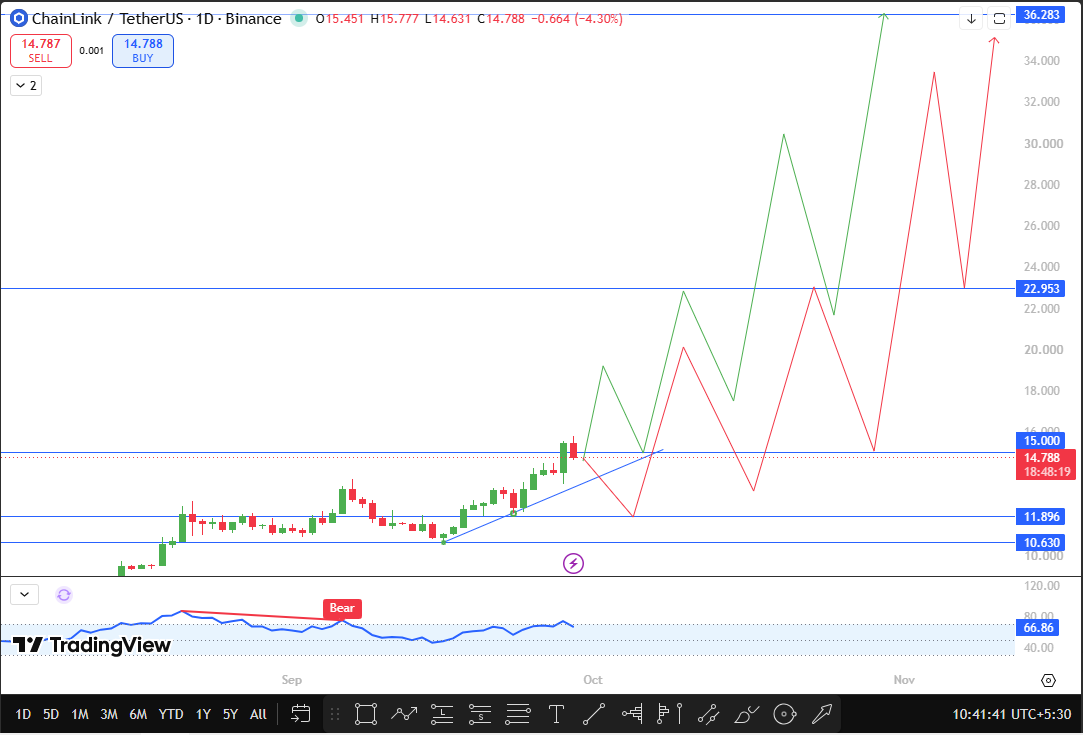
LINK has been climbing off an ascending trendline since early September. On its first retest of that line, price did more than bounce.
It printed a higher high and pushed through, which is the kind of follow-through a healthy trend needs.
Today's candle ran up to $15.777 and then pulled back, closing below the $15.000 mark for now.
A daily close back above $15.000 would show buyers have taken that level.
The oscillator on the chart reads 66.86, so momentum is firm. Earlier in September the chart flagged a bearish divergence, and price worked through it instead of rolling over.
The projected paths on the chart give two routes for the Chainlink price forecast. In one, LINK holds the trendline, bounces, and revisits $15.000 before heading higher.
In the other, it dips all the way to $11.896 first, rebounds, and then continues. Both routes aim at $22.953 and then $36.283, with timelines running into November.
Source: TradingView, 1D Binance, Sep 29, 2026, 10:41 UTC+5:30.
Chainlink Support and Resistance
Level | Type | Distance from CMP |
$36.283 | Major resistance | +145.4% |
$22.953 | Resistance | +55.2% |
$15.000 | Nearby resistance | +1.4% |
$14.788 | CMP | 0% |
$11.896 | Key support and invalidation | -19.6% |
$10.630 | Lower support | -28.1% |
Bull, Base, and Bear Scenarios
Bull case. LINK stays above $11.896 and reclaims $15.000 on a daily close. That opens the road to $22.953, a move of roughly 55% from here. The Swift headline gives the story extra fuel, but price still has to do the work.
Base case. LINK chops between the trendline and $15.000 for a while, digesting the fast run. Sideways action here is normal after a breakout and does not damage the setup.
Bear case. A retest turns into a slide, and LINK drops toward $11.896. A daily close below that level cancels the setup, and $10.630 becomes the next support to watch.
Risks
Derivative volume dwarfs spot volume, so leverage flushes can move the price quickly in either direction.
The Swift news is still work in progress, not a finished integration. Price has already rejected $15.000 once, and a failed retest could pull it back toward the trendline. Broader market swings can override any chart pattern.
Disclaimer
This article is for information and education only and is not financial advice. Crypto assets are volatile, and you can lose money. Do your own research before making any decision.
0
0

 Manage all your crypto, NFT and DeFi from one place
Securely connect the portfolio you’re using to start.


