Solana (SOL) Price Prediction: Can SOL Reclaim $76 and Target $90 — or Is $60 Back in Play?

0
0

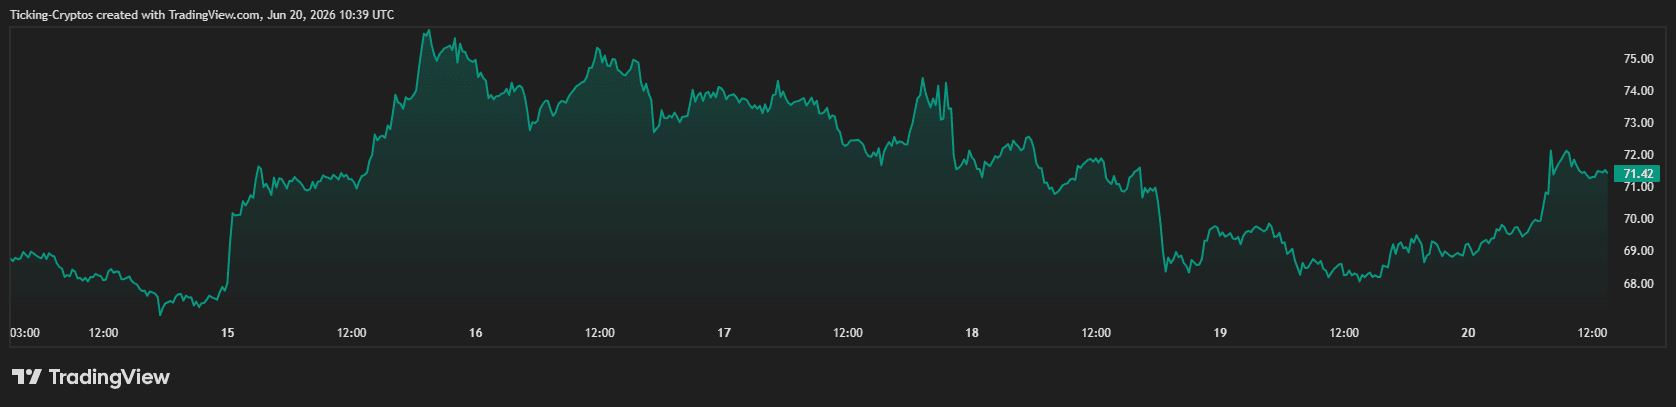
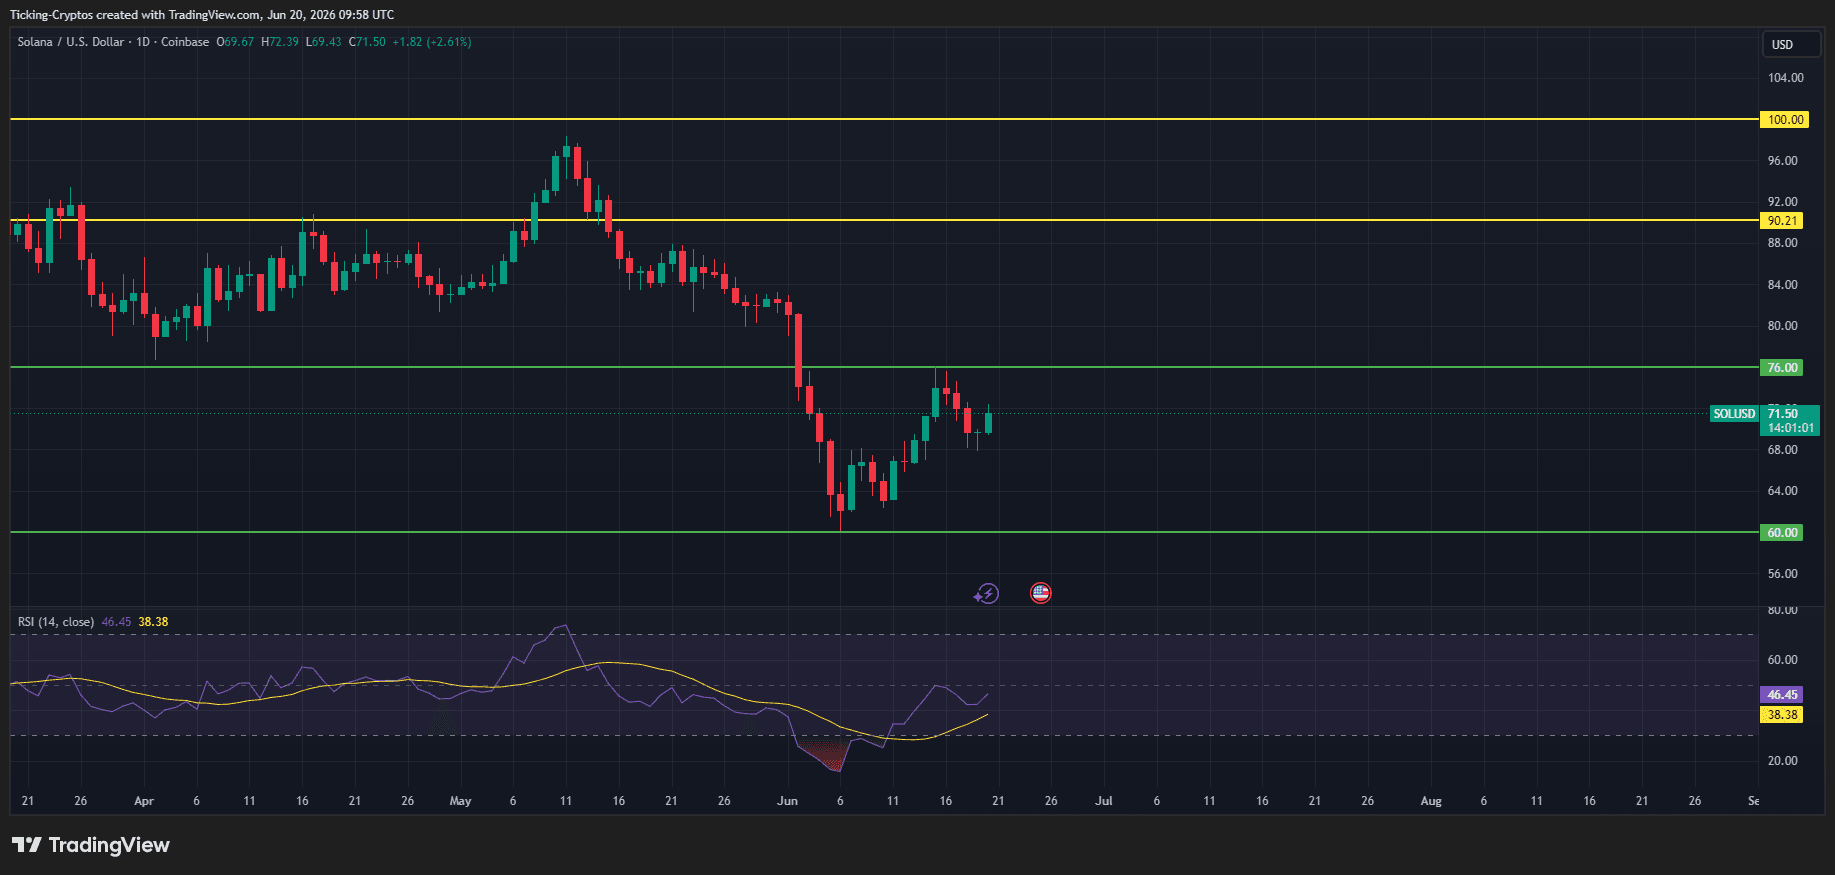
Solana ($SOL) is changing hands around $71.50, up about 2.6% on the day, as it tries to build on a recovery off its early-June lows. The daily chart tells a clear story: SOL peaked near $98 in mid-May, then sold off sharply through late May and early June, bottoming around the $62–63 zone before buyers stepped in and pushed the price back toward the low-$70s.
That makes the current setup a classic post-crash recovery attempt — price has bounced off a major support, but still sits well below the levels that defined its previous range. The question now is whether this bounce has the strength to reclaim lost ground, or whether it's a relief rally inside a broader downtrend.
Solana Analysis: What Do Key Support and Resistance Levels Show?
The chart maps out a clean structure of levels that traders are watching closely. These are the lines that will likely define SOL's next move:
- $60.00 — major support (green). This is the floor that held during the early-June capitulation. As long as SOL stays above it, the recovery thesis remains intact.
- $76.00 — immediate resistance (green). Once a support level, this has flipped to overhead resistance. It's the first real test for buyers and the gateway to higher targets.
- $90.21 — key resistance (orange). The upper boundary of SOL's prior trading range. Reclaiming this would signal a genuine shift back to strength.
- $100.00 — psychological resistance (orange). The round number that capped the May rally. A move here would mark a full recovery of the recent decline.
Right now, SOL sits in the no-man's-land between $60 support and $76 resistance — a zone where the next decisive break tends to set the tone.
What Is the RSI Telling Us About Momentum?
Momentum is where the picture gets interesting. The RSI (14) reads 46.45, with its moving average down at 38.38. Two takeaways stand out:
- The RSI is recovering from oversold. During the early-June plunge, RSI dipped sharply (the shaded zone on the chart), reflecting heavy selling. It has since climbed back toward the midline — a sign the worst of the selling pressure has eased.
- It hasn't reclaimed 50 yet. Staying below the neutral 50 line means momentum is improving but not yet bullish. The RSI crossing back above its moving average is an early positive signal, but bulls need a clean break above 50 to confirm a shift.
In short: the momentum reading supports a recovery attempt, but doesn't yet confirm a trend reversal.
What Are the Bullish Targets if SOL Breaks Out?
If buyers maintain control and SOL pushes higher, the path is mapped by the resistance levels above. A realistic bullish sequence looks like this:
- Reclaim $76.00. The first hurdle. A daily close above this flipped level would confirm the bounce has legs and open the door higher.
- Target $90.21. With $76 cleared, the next logical objective is the prior range high near $90 — a roughly 26% move from current levels.
- Challenge $100.00. A break and hold above $90 would put the psychological $100 mark back in play, completing a full recovery of the May–June decline.
For this scenario to unfold, SOL likely needs supportive conditions from the broader crypto market — particularly $Bitcoin — alongside the RSI reclaiming the 50 level to confirm momentum.
What Happens if Solana Support Fails?
Balance requires looking at the downside too. The recovery is real but fragile, and a failure to hold current levels would shift the bias back to the bears:
- Losing the low-$70s would suggest the bounce is fading and bring the recent lows back into focus.
- A break below $60.00 would be the more serious signal. It would invalidate the recovery structure and expose SOL to deeper downside, with the $50–55 region emerging as the next major demand zone.
This is why $60 is the line that matters most on the downside — it's the difference between "healthy pullback within a recovery" and "resumption of the downtrend."
Solana Future: What Is the Overall Solana Price Outlook?
Pulling it together, SOL sits at a genuine decision point. The bullish case is that price has defended a major support at $60, momentum is recovering off oversold, and a reclaim of $76 would open a path toward $90 and potentially $100. The bearish case is that SOL remains below its key moving averages, RSI is still under 50, and a loss of $60 would reopen significant downside.
For traders, the roadmap is clean:
- Bullish trigger: a daily close above $76, targeting $90 then $100.
- Bearish trigger: a daily close below $60, targeting $50–55.
- Neutral zone: between $60 and $76, expect choppy, range-bound action until one side breaks.
As always with Solana, the broader market backdrop — Bitcoin's direction, risk appetite, and ETF flows — will likely be the deciding factor in which way this resolves.
0
0

 Manage all your crypto, NFT and DeFi from one place
Securely connect the portfolio you’re using to start.


0
0


0
0