
Price Prediction 9/28: BTC, ETH, BNB, XRP, SOL, ZEC,

0
0

SOL is one of the top losers over the last 24 hours, trading down by more than 4%. It currently trades around $118, a level with notable demand concentration.
According to the 4-hour chart, losing this level could result in a steeper decline. However, the selloff affecting SOL is not an isolated event. The global cryptocurrency market cap also retraced slightly during the first half of Monday.
Nonetheless, current chart readings indicate notable buybacks across the market. SOL is also experiencing this bullish activity and has recovered some of its losses. It remains to be seen whether this will mark the beginning of a significant uptrend.
Away from price action, the employment and PCE reports are some of the biggest the U.S. economic data releases this week. Meanwhile, traders are grappling with the possibility of a deeper decline. The Fear & Greed Index currently stands at 68, down four points from the previous day’s reading.
Overall, bearish sentiment is growing across the market. Despite these concerns, assets such as HBAR and ALGO are up by 33% and 15%, respectively.
Let’s see what the charts say about the assets in the top 10.
BTC/USD
Following last Monday’s massive 6% surge, Bitcoin failed to register a significant upward move throughout the rest of the week. It remained rangebound around $83K, slipping below the level on some occasions.
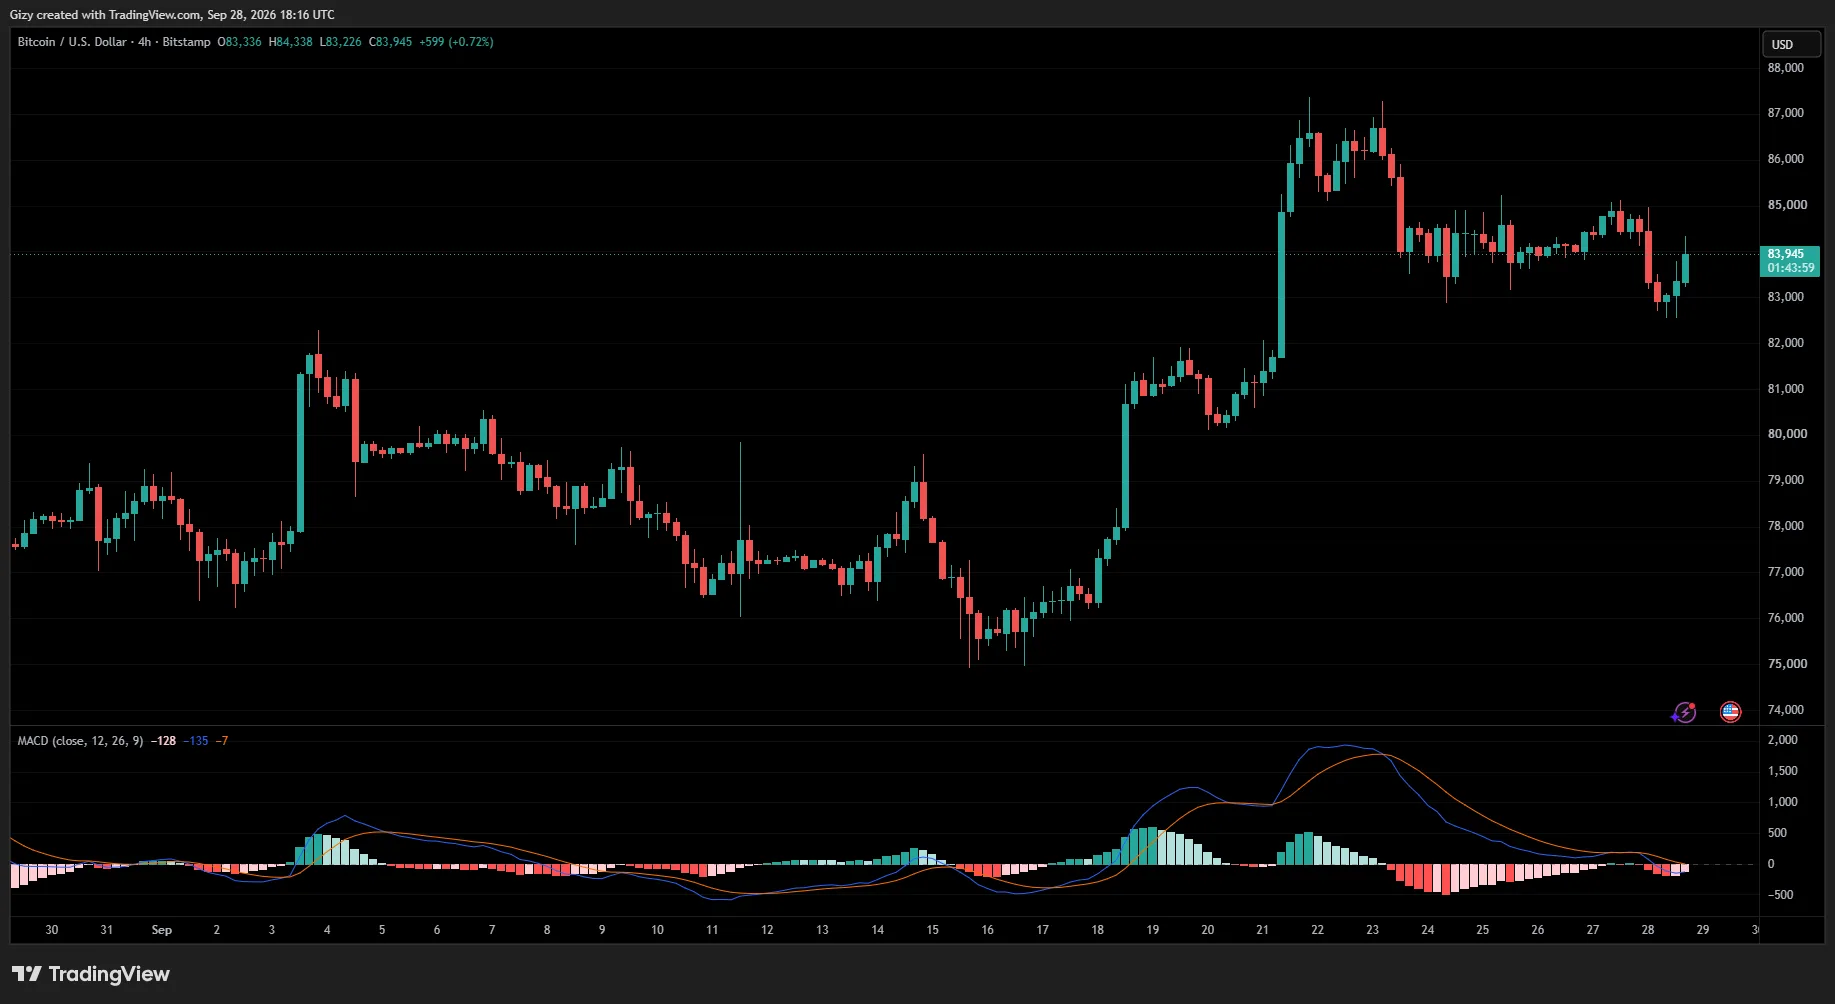
The apex cryptocurrency is off to a weak start this week, retracing to a low of $82,555 a few hours ago. Although it has since rebounded, it has yet to fully erase its losses, and concerns over its next price action remain high.
A closer look at the 1-day chart shows that while the recent decline is significant, Bitcoin remains within the same broader trading zone as last week.
BTC has yet to break out of its consolidation phase, meaning the current trend could continue over the next six days. However, the 4-hour chart provides more insight into its potential next move.
The apex cryptocurrency is currently trading below a level it held for most of the previous week: $83,700. It recently faced rejection while attempting to reclaim this mark. If BTC fails to break above the resistance, it could retest the $80K support level next.
ETH/USD
Ethereum’s 1-day chart is filled with several doji candles following last week’s price action. After the movements recorded between Monday and Wednesday, the asset experienced relatively mild volatility and remained mostly rangebound.
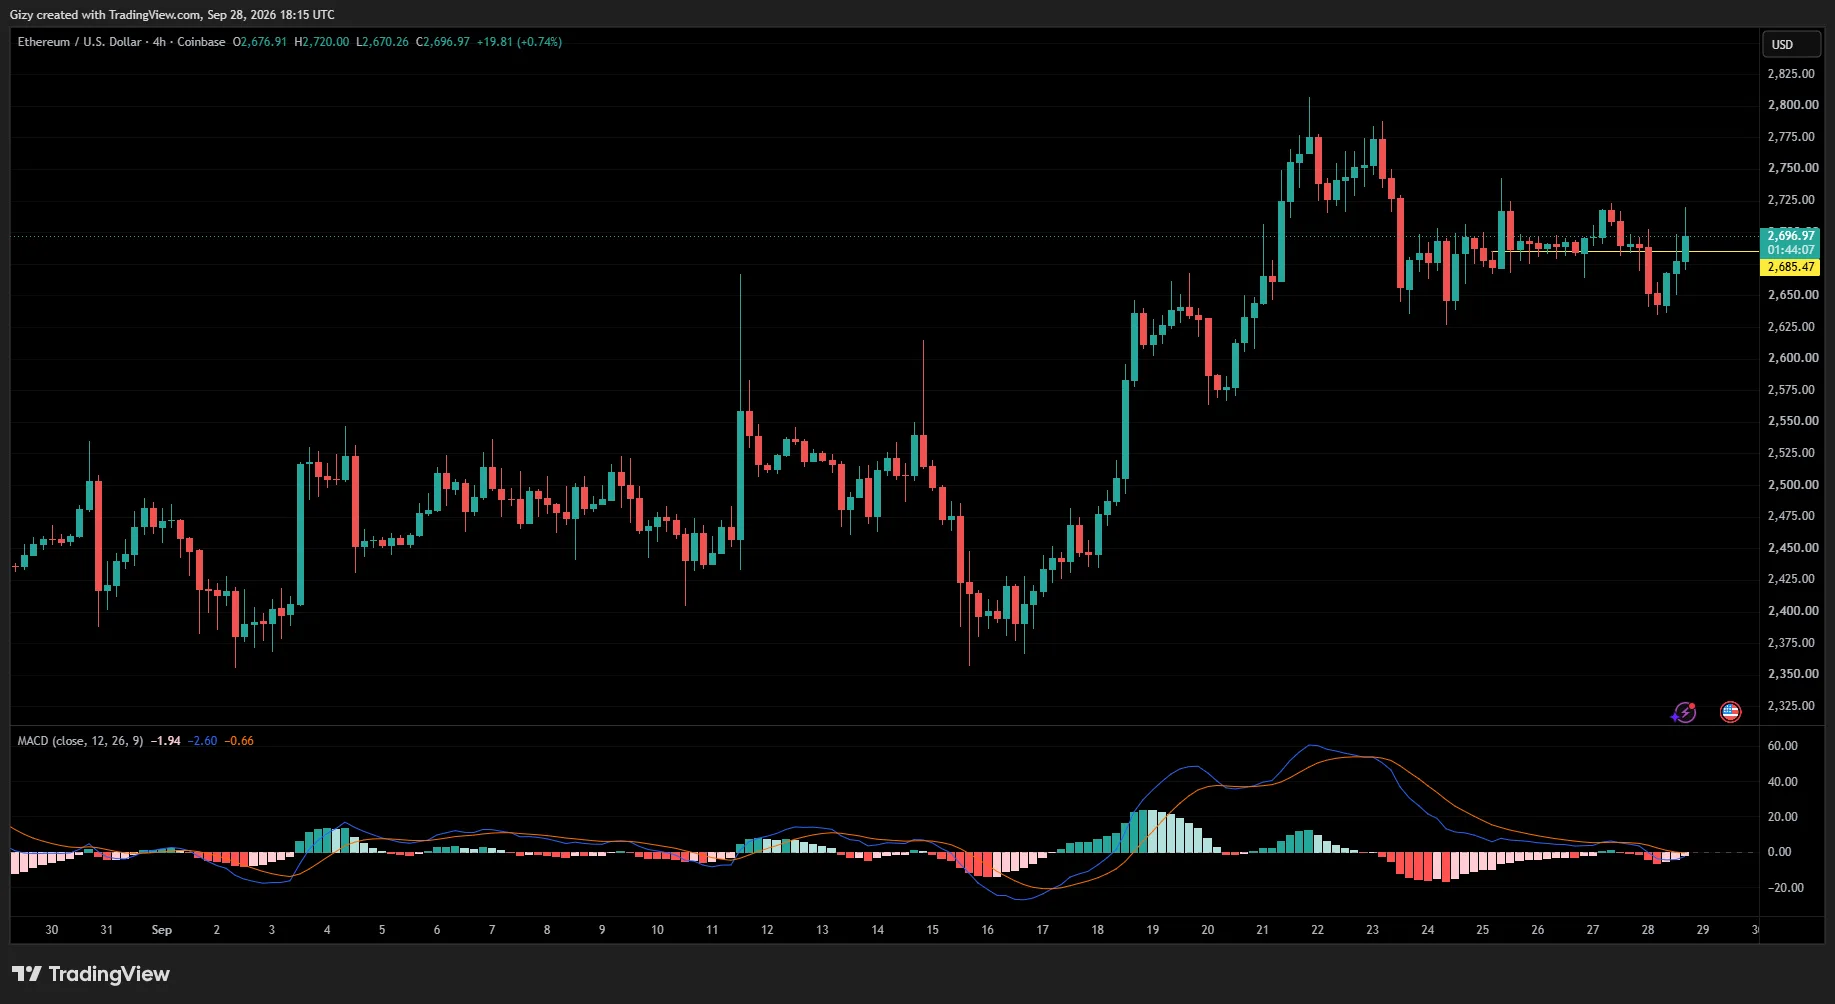
The situation remains similar at the time of writing. ETH recently retraced to $2,634 before rebounding. It is currently trading close to its opening price, and the likelihood of the asset closing the day significantly higher appears reduced given the recent trend.
A closer look at Monday’s price action reveals several negative developments. One of them is consistent rejection around $2,700. While this is not the first time ETH has encountered resistance at this level, the latest rejection could signal further downside in the coming days, particularly as the asset has yet to reclaim $2,685.
If the trend continues, ETH could decline by another $100 in the coming days.
Conversely, the Moving Average Convergence Divergence (MACD) is printing bullish signals at the time of writing. Based on the indicator, ETH could be gearing up for another attempt at $2,800.
BNB/USD
BNB recently rebounded from $756 following the significant selloff that swept through the market during the first half of Monday.
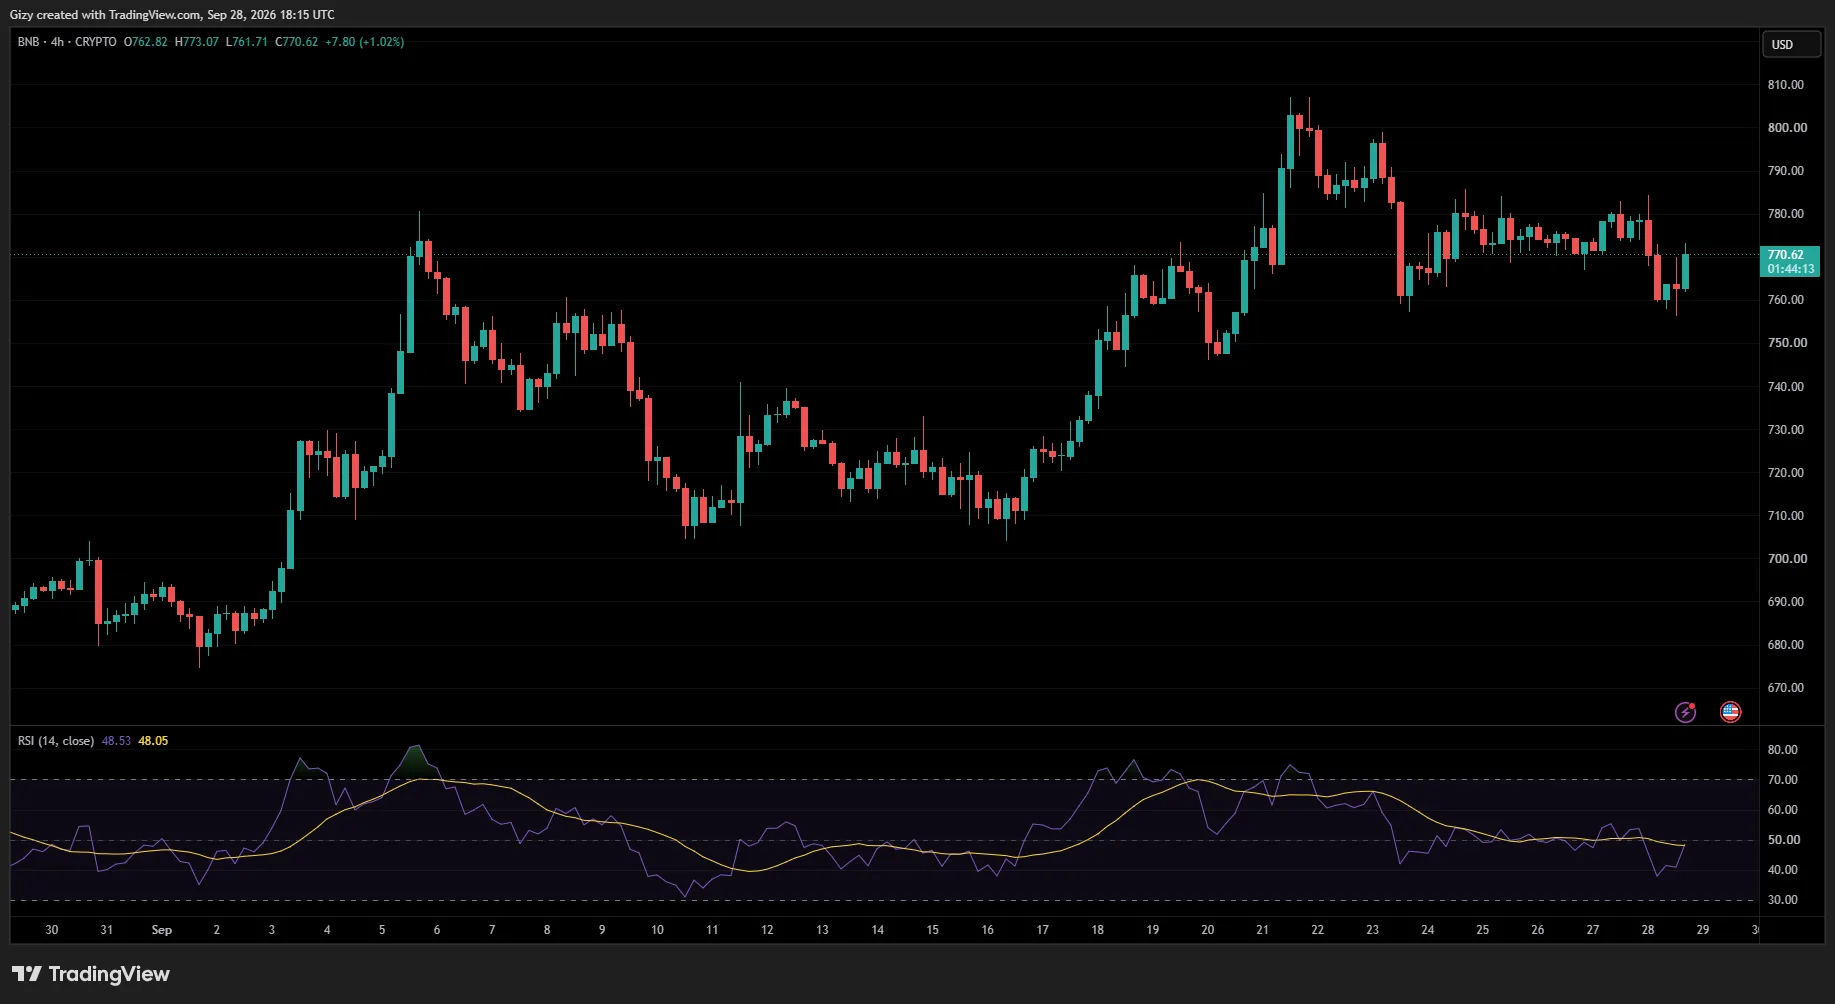
The 4-hour chart shows that buying activity is picking up, and the asset may be gearing up to retest a key resistance level.
The Relative Strength Index (RSI) suggests that buying pressure is improving, which could provide the catalyst for another upward move. Based on previous price action, an attempt at $785 may be imminent.
However, previous price movements show notable selling pressure around this level. As such, BNB could face another rejection if it reaches $785. If that happens, the asset may remain within the $760-$780 range over the next few days, as it did last week.
XRP/USD
The 4-hour chart shows that XRP has been declining since Friday. Like SOL, the coin also retraced on Monday. However, recovery is underway, with XRP recently attempting to reclaim $1.54.
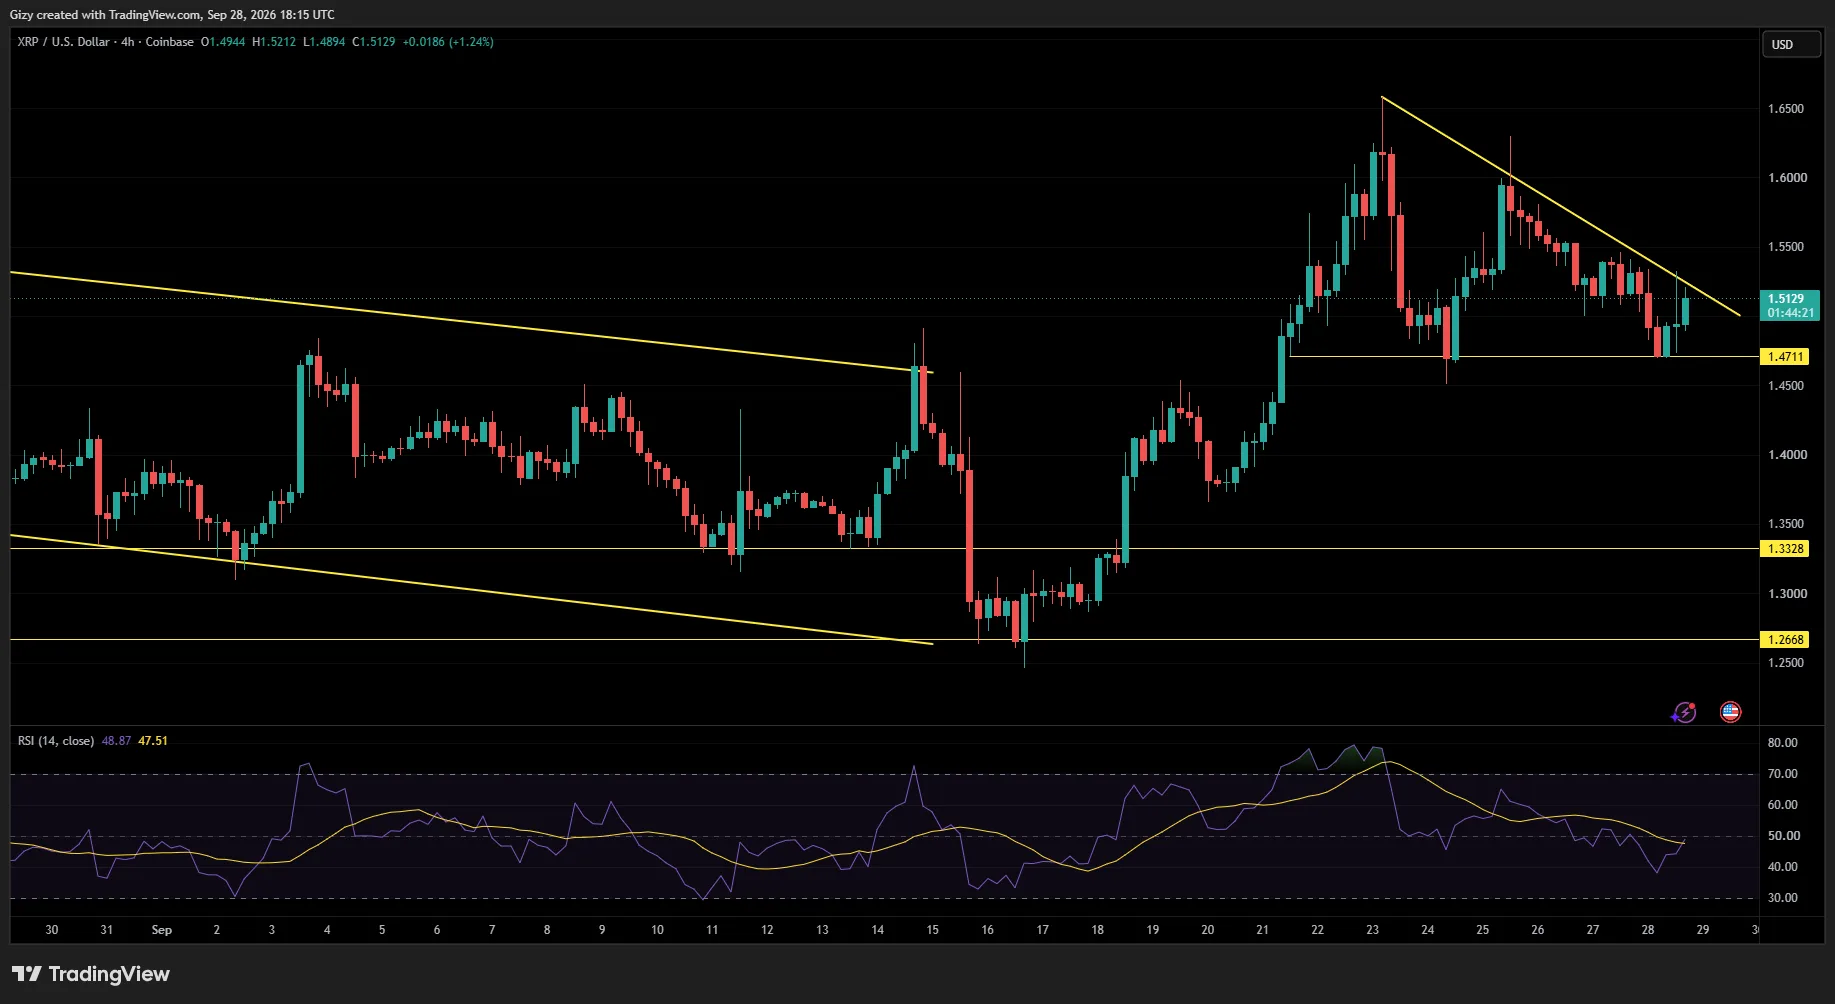
Interestingly, it rebounded close to the previous week’s low. Zooming out, the altcoin is trading within a symmetrical triangle, suggesting that a breakout could be approaching.
The last two candles failed to break out of the pattern, potentially setting the stage for another downward move. If that happens, the next target could be around $1.47.
Regarding the potential breakout scenarios, the RSI supports the possibility of continued upward momentum, which could push XRP toward $1.55.
SOL/USD
Between Thursday and Sunday, SOL surged as predicted. However, upward momentum waned during the second half of the previous intraday session, and the resulting bearish pressure saw the asset retrace by more than 3% on Monday.
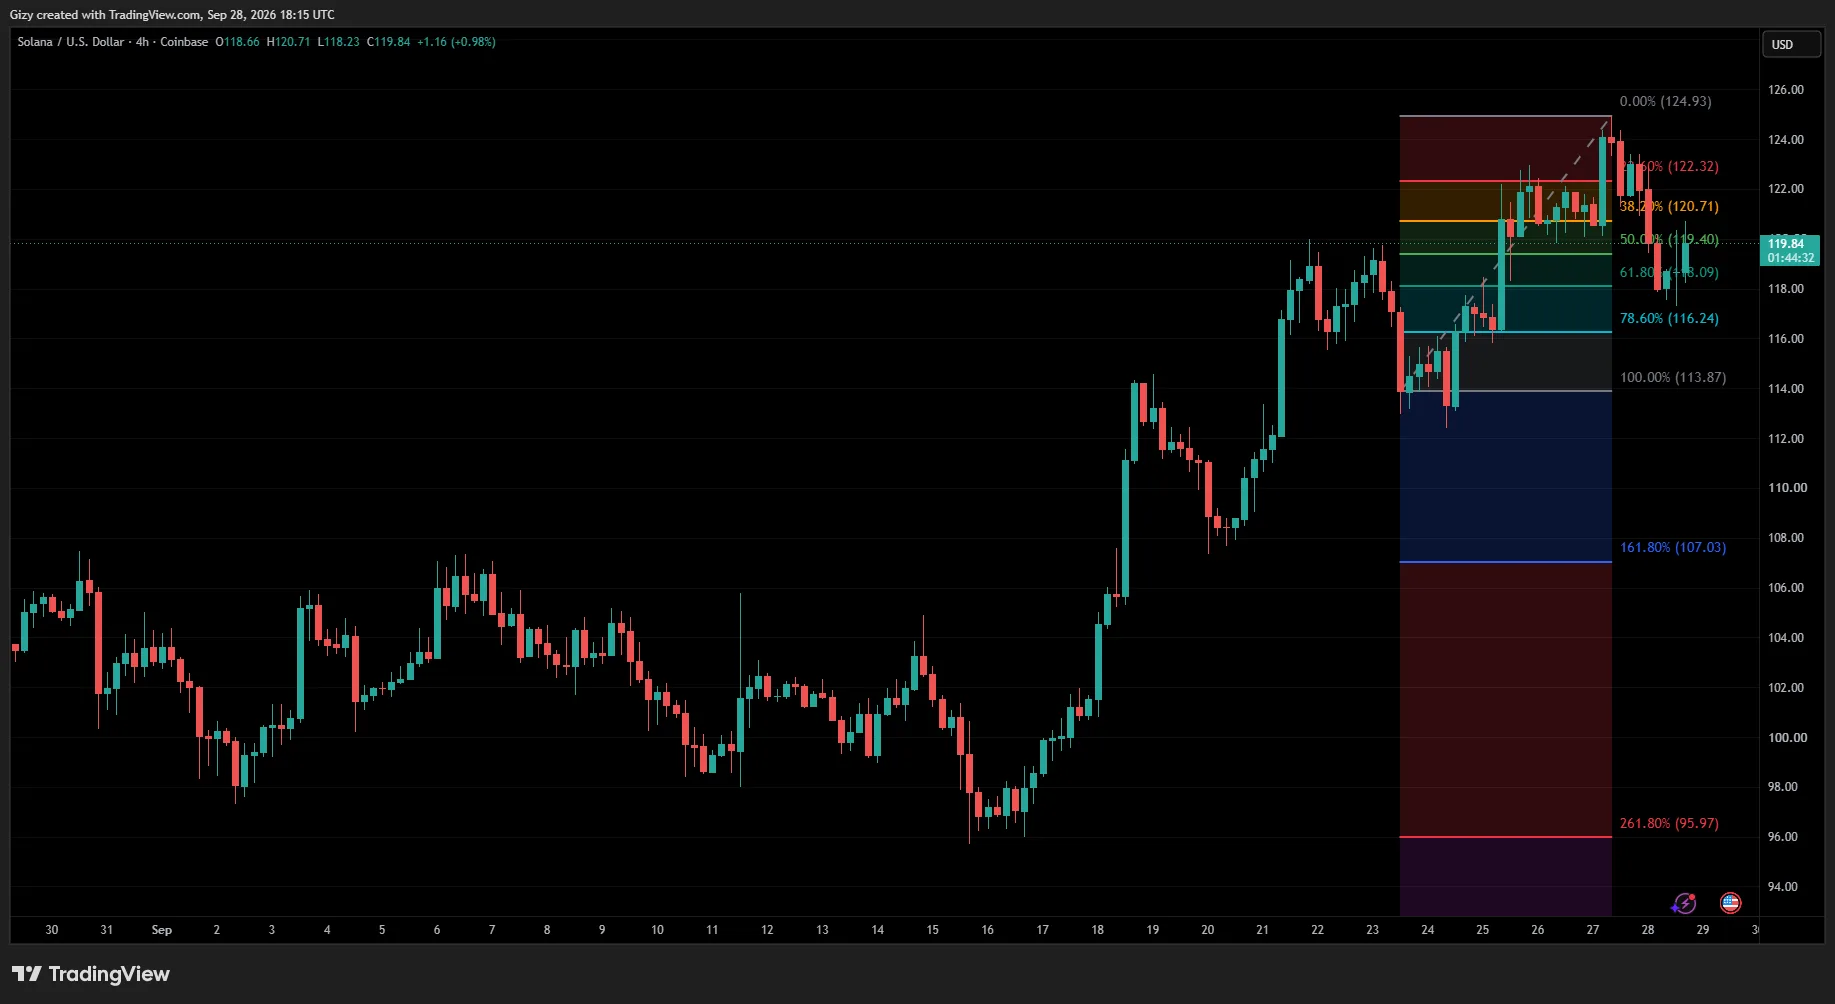
Interestingly, SOL rebounded close to the 61% Fibonacci retracement level but has yet to maintain trading above the 50% level. The Fibonacci structure suggests that the coin could retrace further in the coming hours.
The 78% retracement level appears to offer stronger support and could provide a potential rebound zone.
Conversely, indicators such as the MACD and RSI point to improving buying momentum, which could trigger a move toward $122.
ZEC/USD
ZEC reached another milestone last week, hitting a new eight-year high. However, it faced significant rejection around $1,700 and has since been declining. Like SOL, the coin continued its downward trend into Monday.
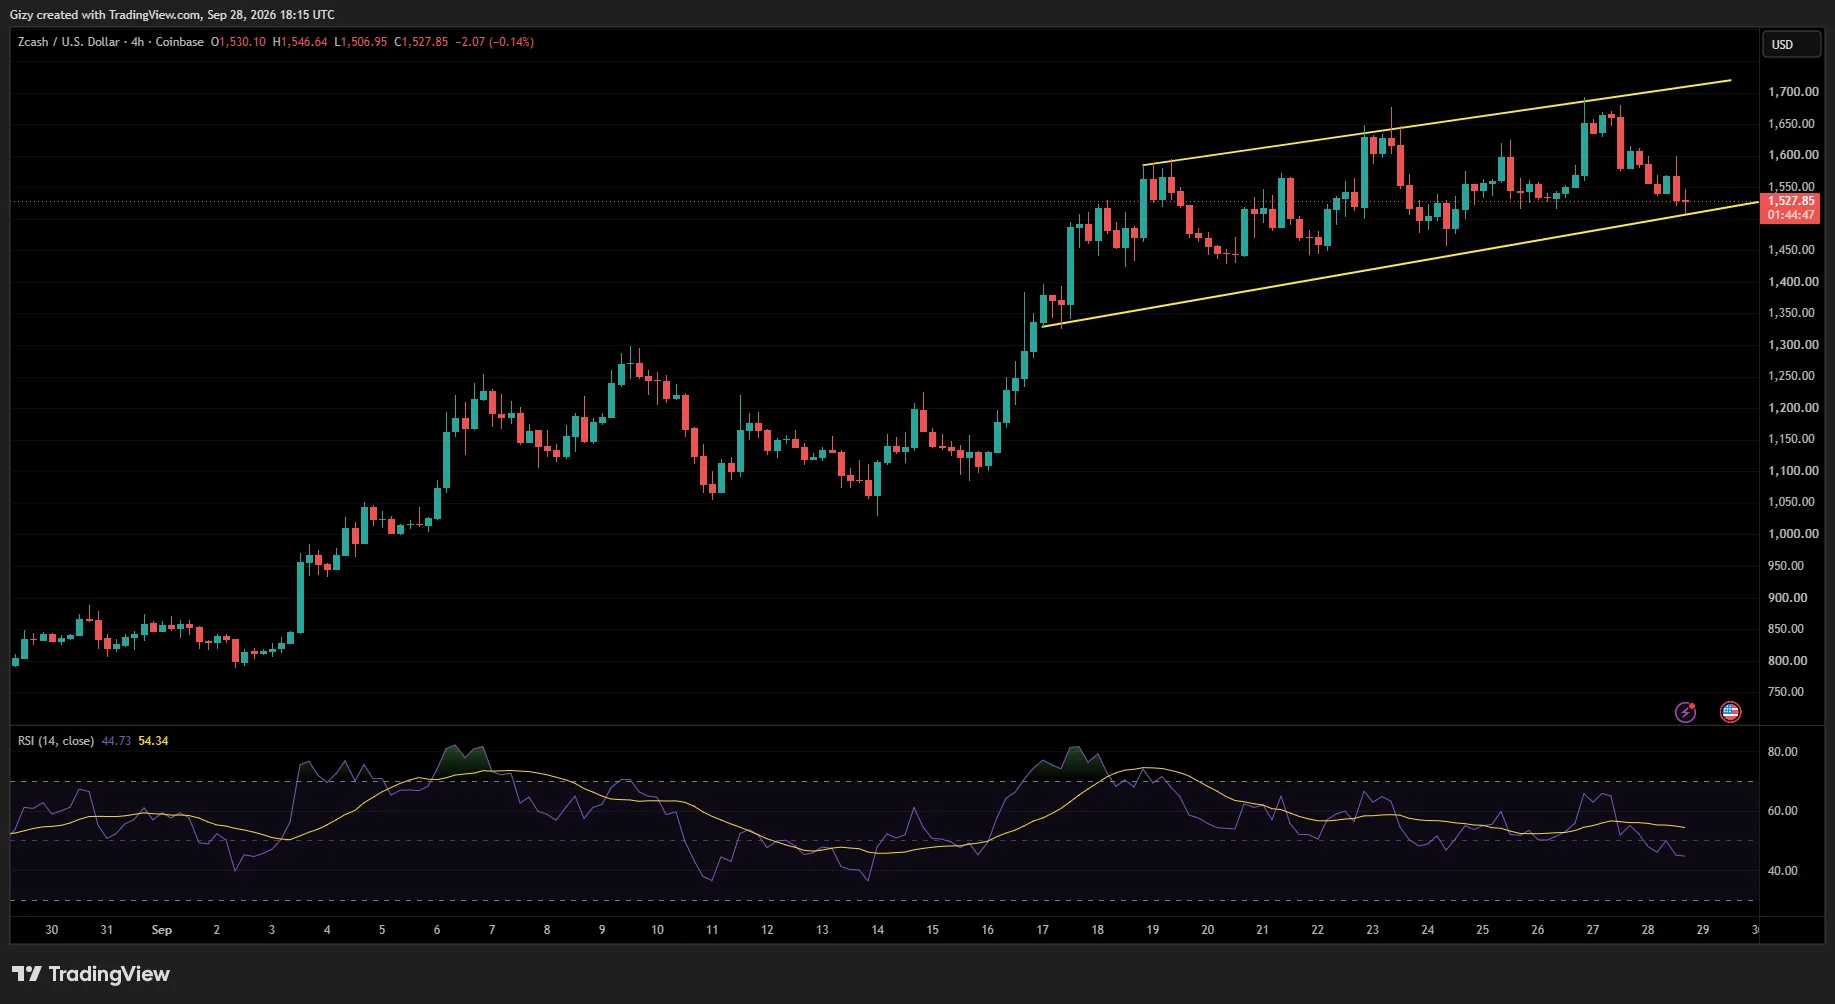
ZEC recently rebounded from $1,500, and it remains to be seen whether this will mark the beginning of a significant recovery.
Nonetheless, the altcoin continues to maintain its broader upward trend despite the recent decline. It is currently at a critical juncture.
If ZEC retraces further and loses $1,500, it could break below the broader trend and signal the beginning of a deeper downtrend.
Interestingly, the RSI and MACD have yet to provide a strong bullish signal, suggesting that the risk of further downside remains elevated.
The post Price Prediction 9/28: BTC, ETH, BNB, XRP, SOL, ZEC, appeared first on CoinTab News.
0
0


 Manage all your crypto, NFT and DeFi from one place
Securely connect the portfolio you’re using to start.


