
$PEPE Jumps 18% as Bulls Target More Upside: Pepe Price Prediction

0
0

Pepe launched in April 2023 as an Ethereum-based meme token built entirely around the well-known Pepe the Frog internet meme, with no utility promised beyond community and culture from day one.
It quickly grew into one of the largest meme coins by market cap, riding waves of social attention during broader crypto rallies.
$PEPE is trading around $0.00000349, up 16.5% in the past 24 hours.
Live Market Data
Here's the live snapshot behind this Pepe price prediction as of writing.
Metric | Value |
Price | $0.0000034774 |
24h Change | +16.5% |
Market Cap | $1.463B |
Fully Diluted Valuation | $1.463B |
24h Trading Volume | $596.772M |
Circulating Supply | 420.69T |
Total Supply | 420.69T |
Max Supply | 420.69T |
Source: $PEPE market cap data taken from Coingecko, data as of Aug 21, 2026. Figures may vary slightly across other tracking websites.
Liquidation Snapshot
Pepe's derivatives market has been active through this bounce.
Over the past 24 hours, $2.14M in positions got liquidated, with shorts taking the bulk at $1.45M against $686.40K on longs, lining up with a move that caught short sellers leaning the wrong way. 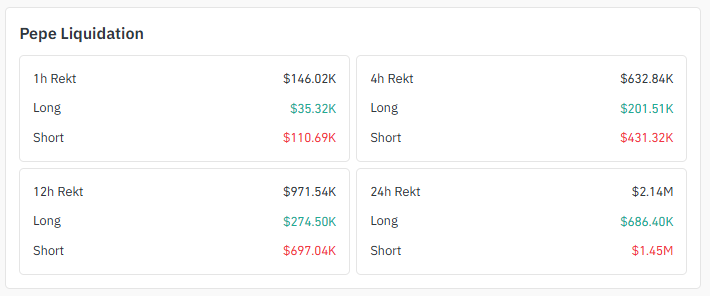
Source: Liquidation Data Taken From Coinglass.
The 12-hour window tells a similar story: $697.04K in short liquidations against $274.50K on longs.
Even the last hour kept that pattern going, with shorts eating $110.69K of the $146.02K total wiped out.
Exchange Volume
Exchange | 24h Volume |
OKX | $314.78M |
MEXC | $261.16M |
LBank | $109.12M |
Bitget | $61.27M |
Bitunix | $39.81M |
KuCoin | $36.32M |
Gate | $33.27M |
Source: Volume Heatmap Data Taken From Coinglass.
Social Sentiment of $PEPE
Market commentary today ties PEPE's move to a broader memecoin rally running alongside a wider market rebound.
Reports point to PEPE gaining around 15% in a single day and 17% across the week, with almost the entire weekly gain packed into a breakout that started earlier this week. 
Source: Data Taken From @BSCNews, X Account.
The token has also climbed back into the top 50 by market cap.
This move isn't happening in isolation either; Dogecoin, Shiba Inu, and Pudgy Penguins' PENGU are all showing double-digit daily gains alongside it.
Why it matters for PEPE: sector-wide memecoin strength tends to reinforce a bounce like this one, since capital rotating into the group as a whole gives PEPE extra tailwind beyond just its own chart setup.
Key Takeaways
PEPE bounced off a clear support zone on the 4H chart and is now using a rising trendline as fresh support, which keeps this PEPE price prediction leaning bullish.
Price is trading near $0.00000349, up 16.5% over the past 24 hours.
Hold momentum above the trendline, and the next stop is $0.00000366, then $0.00000399, with $0.00000459 as the bigger level.
Get rejected at resistance, and the price could slide back toward the $0.00000311 support level instead.
The broader memecoin sector is rallying together right now, with Dogecoin, Shiba Inu, and Pudgy Penguins all posting double-digit gains alongside PEPE.
24-hour liquidations hit $2.14M, and shorts took the bigger hit here at $1.45M.
Technical Analysis: $PEPE 4-Hour Chart Analysis
PEPE spent a good stretch grinding sideways inside a defined support zone on the 4H chart before buyers finally stepped back in and pushed the price higher.
Since that bounce, a rising trendline has formed underneath price, and so far every pullback toward that line has been bought rather than sold, which is exactly the kind of behavior that keeps a short-term uptrend intact.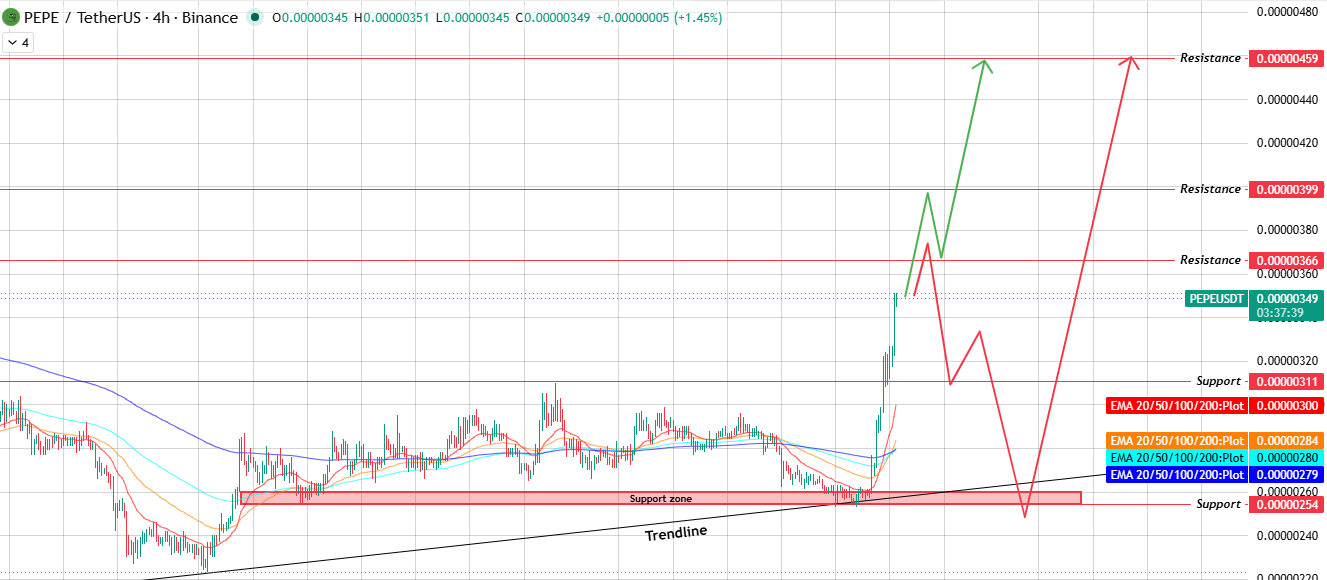
Source: Chart taken from TradingView.
As long as that trendline keeps holding as support, momentum can carry price toward $0.00000366 first, then $0.00000399, with $0.00000459 as the bigger level if buyers keep showing up.
If price instead gets rejected at resistance and the trendline breaks, a slide back toward the $0.00000311 support becomes the more likely path, with $0.00000254 as the deeper level if selling pressure builds further.
On top of the trendline structure, price is currently trading above its entire EMA cluster on the 4H chart, spanning the 20, 50, 100, and 200 EMA.
That kind of alignment, with every major moving average sitting below the current price, is another sign buyers are firmly in control on this timeframe right now.
Support and Resistance Levels
Chart-derived levels are shaping this Pepe price prediction right now.
Level | Type |
0.00000459 | Resistance |
0.00000399 | Resistance |
0.00000366 | Resistance |
0.00000349 | Current Price |
0.00000311 | Support |
0.00000254 | Support |
EMA Levels
EMA | Value | Price Position |
20 EMA | 0.00000300 | Price trading above |
50 EMA | 0.00000284 | Price trading above |
100 EMA | 0.00000280 | Price trading above |
200 EMA | 0.00000279 | Price trading above |
Bull, Base, Bear Case
This Pepe price prediction breaks into three scenarios depending on whether the rising trendline keeps holding as support.
Case | level | Setup | Invalidation |
Bull | 0.00000459 | Trendline support holds, and momentum carries price through both nearer resistance levels. | 4H close back below 0.00000311 |
Base | 0.00000366 | First resistance right above the current price, the natural pause point after the bounce | Loss of the 0.00000330 area on a 4H close |
Bear | 0.00000311 | Rejection at resistance breaks the trendline, and the price falls back into the support zone. | 4H close under 0.00000254 |
Glossary
Support Zone: A price range where buying pressure has repeatedly stepped in strongly enough to halt a decline.
Trendline Support: A rising line connecting a series of higher lows, used to gauge whether an uptrend is still intact.
EMA (Exponential Moving Average): A trend indicator that weights recent price action more heavily, often used to gauge whether momentum favors buyers or sellers.
Liquidation: The forced closing of a leveraged position once losses eat through a trader's available margin.
Rejection: When a price approaches a resistance level and gets pushed back down rather than breaking through it.
Methodology
This Pepe price prediction draws on multi-source data, including 4H timeframe chart structure, EMA positioning, live liquidation figures, exchange volume distribution, and current market sentiment across the broader memecoin sector.
Price levels referenced here come directly from chart structure rather than extrapolation.
Markets move fast, so treat these levels as a framework rather than a fixed outcome.
Disclaimer: This article is for informational purposes only and does not constitute financial advice. Cryptocurrency markets, including Pepe, are highly volatile and carry significant risk. Always do your own research and consult a licensed financial advisor before making investment decisions.
0
0

 Manage all your crypto, NFT and DeFi from one place
Securely connect the portfolio you’re using to start.


