Ripple (XRP) Price May Fall Short-Term, Indicating a Buy Opportunity
14d ago•

bullish:
0
bearish:
0
Share

Ripple’s (XRP) price rallied to a one-month peak of $0.56 on May 6. But has since shed 9% of its value.
Although the altcoin remains at risk of a price decline in the short term, it may present a buying opportunity for traders looking to trade against the market.
Ripple Has Little to Offer in the Interim
XRP currently trades below its 20-day Exponential Moving Average (EMA) at $0.51. The token’s price crossed under this key moving average on May 13, confirming the uptick in its sell-offs among market participants.
When an asset’s price falls below its 20-day EMA, it signals that its value trades under its average price of the past 20 days. It is interpreted as a bearish signal and a shift in momentum from buying to selling.
Market participants view it as a sign that an asset’s price might initiate a downtrend or continue to fall.
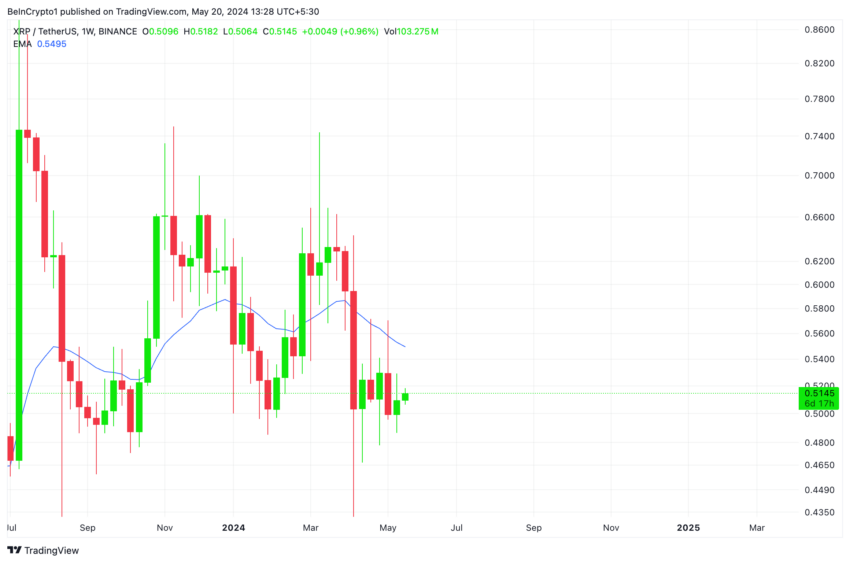 Ripple Price Analysis. Source: TradingView
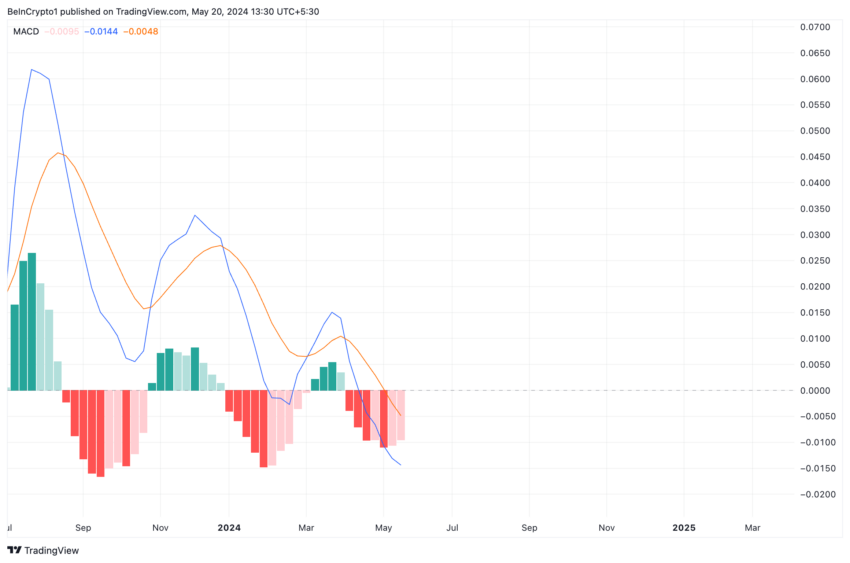
Further, readings from XRP’s Moving average convergence/divergence (MACD) showed its MACD line (blue) resting below its signal (orange) and zero lines.
This indicator identifies the changes in an asset’s trend or momentum during a specific period.
Read More: Everything You Need To Know About Ripple vs SEC
 Ripple Price Analysis. Source: TradingView
When an asset’s MACD line is positioned under its signal and zero lines, it signals that its short-term moving average has fallen below its long-term moving average. It is a bearish sign; market participants view it as a sign to exit long and open short positions.
XRP Price Prediction: Time To Buy?
XRP’s Market Value to Realized Value (MVRV) ratio observed using 30-day and 365-day moving averages posted negative values of -1.3% and -9.8%, respectively. This may be a good buying opportunity for those looking to buy the dip and trade against current market movements.
The MVRV tracks the ratio between an asset’s current market price and the average price of its coin or token circulation. When an asset’s MVRV ratio is negative in this manner, it is undervalued because its current market price is less than the average purchase price of all its tokens in circulation.
This is seen as a buy signal. It suggests that the asset in question currently trades at a price lower than its historical cost basis.
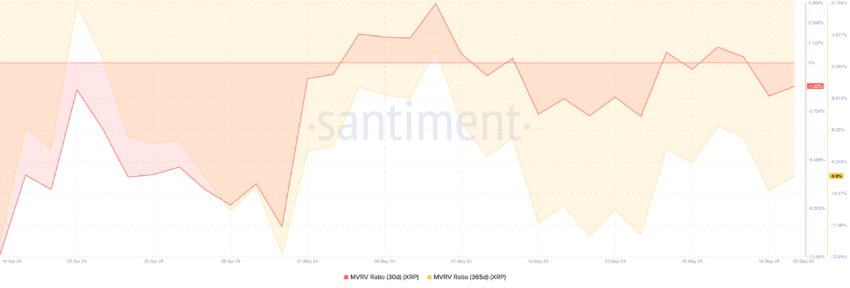 XRP Market Value to Realized Value. Source: Santiment
Further, XRP’s positive funding rates in its futures market suggest that traders continue to hold long positions despite the token’s recent price troubles.
If XRP sees significant accumulation, the bulls may be able to push its price above $0.53 and toward $0.57.
 Ripple Price Analysis. Source: TradingView
However, if the current bearish trend gains momentum, the token’s value may fall under $0.5 to trade at $0.44.
14d ago•
bullish:
0
bearish:
0
Share

 Manage all your crypto, NFT and DeFi from one place
Securely connect the portfolio you’re using to start.

bullish:
0
bearish:
0


bullish:
0
bearish:
0